An indicator which can calculate total open order's profit loss by shifting of line on one chart where orders are open.
Example: Calculation Net Price Indicator
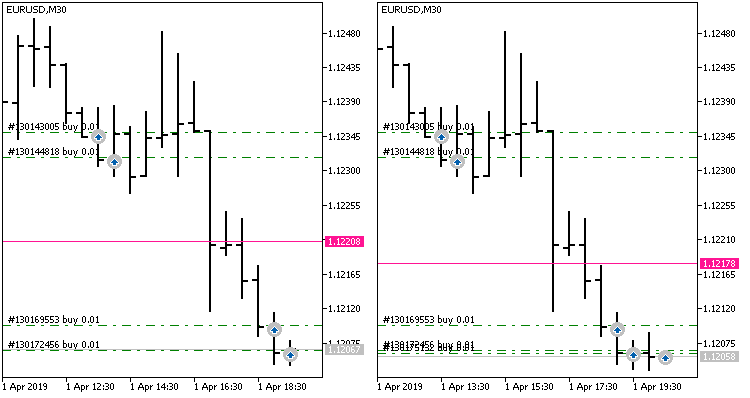
The indicator displays three lines: netting price for BUY, for SELL and total for BUY and SELL.
An example of work when first four BUY positions are opened, and then another BUY position is added:


- www.mql5.com
Example: Calculation Net Price Indicator
The indicator displays three lines: netting price for BUY, for SELL and total for BUY and SELL.
An example of work when first four BUY positions are opened, and then another BUY position is added:
Sir, that is beautiful, may i ask if we wanted to change the value of break even, how should we change it?
for
example, suppose:
criteria 1:: if i wish to set break even value to a "fix pips" (like 50 pips)
criteria 2:: if i wish to set breakeven value to a "percentage pips" (like with every trade that is opened in one direction a certain pips would be
increased in target price, meaning more the market goes negative and more one direction open trades are open then, the target price will have
more profits than just fix 50 pips over the same trading method.)
here i assume to add for every new trade that is opened i want a 0.5 pips to be added gradually so target price does not go way beyond the limit and it
is also achieved.
how do you find it sir? i feel it's brilliant.
- Free trading apps
- Over 8,000 signals for copying
- Economic news for exploring financial markets
You agree to website policy and terms of use
kindly help me with codes, as it is simple to look but is very difficult for me to understand.