- [ARCHIVE!] Any rookie question, so as not to clutter up the forum. Professionals, don't pass by. Can't go anywhere without you - 4.
- Taking Neural Networks to the next level
- Andromeda EA

- www.mql5.com
Yes I agree with that, I think the correlation may be helpful but not sure if it can reliably be tested since it changes ,I was looking at correlation(100) but again im not sure if it was helpful really. Maybe you have some ideas about testing correlation?
My idea for a manual strategy for this is to take 2 pairs eg. EurUsd and UsdJpy and overlay the chart with that indicator. Then what I am interested in is trading the convergence and hedging out divergence by offsetting the open trade with and opposite trade. This is not different to a stop loss but the goal is to switch off the hedged trade when you feel comfortable that the two graphs are no longer diverging. This would require analysis and judgement of the candles but atleast the trading strategy is clear (and not confused) about its direction .
The hedge trade can be done as a stop order that trails the candles
Interesting article Brian. Upon further consideration, i realize arbitrage might be more than I can handle right now. I think the main lesson here is that trading multiple pairs doesn't mean a trader is diversifying smartly; because the pairs traded may have a strong hidden relationship. This can also imply that my exposure/risk has been increased, even though the pairs are different. So maybe a better strategy would be to test for correlation before ordering additional pairs, right?
It is always good to investigate. If you look at the symbols on your OP, it is 3 times EUR vs 3 times JPY. Depending on your positions on each (long or short) it defines your exposure. There could be 2 things at play.
Exposure:
For example when buying 1 lot EURUSD you buy EUR and sell USD. Now another opportunity arrives for GBPUSD. Again you buy 1 lot, buying GBP, selling USD. Effectively the exposure to EUR and GBP are the same. Same direction different currency. However exposure on USD is double the size on EUR and GBP. You are at the sell side 2 times on USD with the same volume.
Correlation:
This is when 2 different instruments behave the same and show somewhat the same pattern either positive or negative.
Both are worth while to consider when trading multiple assets at the same time for managing risk. Correlation and exposure are not the same, but trading correlated instruments also affect the exposure. For example trading both AUD CAD which are both affected by Oil news with impact.
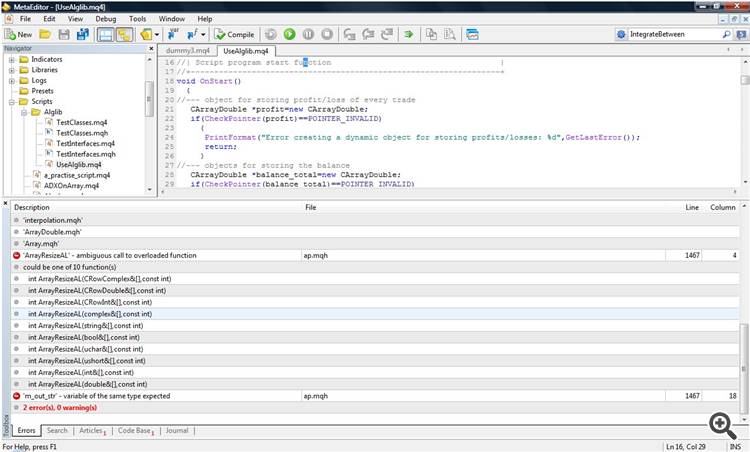
alglib is working, i used it but you gotta use it correctly
Hi. My EA trades multiple pairs simultaneously and I encountered a situation today I am trying to understand. Using a custom keltner channel indicator, I received a "BUY"(Long) trade signal from each of these pairs: EURUSD, EURJPY, EURCHF, CADJPY, CHFJPY, AUDJPY within seconds of each other, after waiting weeks. Does anyone know if these specific pairs have historically moved in lock-step with each other? Or maybe this is just simply coincidence? I doubt this is an indicator error because only one out of the six lossed and that loss is approx US$ 0.72,which is just shy of break even. My account is in US$. This might mean that arbitrage trading is where the real profit is.
- Free trading apps
- Over 8,000 signals for copying
- Economic news for exploring financial markets
You agree to website policy and terms of use

