Do renko charts use time or not?
- Fractals - Bill Williams' Indicators - Indicators - Charts - MetaTrader 5 for Android
- Fractals - Bill Williams' Indicators - Indicators - Chart - MetaTrader 5 for iPhone
- Fractals - Bill Williams' Indicators - Technical Indicators - Price Charts, Technical and Fundamental Analysis
Some people say that renko charts eliminate time, but on renko i know that after the price x, the market goes to price y. I have a notion of before and after, so my question, why it's not considered time? And if it's considered time, so we have 2 kinds of time on the markets, the original and the renko time?
Renko chart uses price movement rather than time and volume.
Renko chart uses price movement rather than time and volume.
for example:
renko chart
10 previous block value
11 current block value
No it is not time. A new bar forms when a block size is exceeded. That could take ten seconds to ten days. Not time.
No it is not time. A new bar forms when a block size is exceeded. That could take ten seconds to ten days. Not time.
When is time or not?
You might read the "when" as "whenever" since there is no set time when the bar range is exceeded.
Maybe some of the confusion is English but if you watch a Renko chart on various pairs and CFDs you will understand it better. It is best to start with a DEMO account.
It is also obvious if you compare any chart with a timeframe side by side with a Renko chart of the same instrument.
Good luck.
Attached is an ERUUSD chart wwith M1 Renko, H1 Renko, Daily OHLC bars, and H1 OHLC bars. The differences are obvious as is the fact both the "M1" and "H1" renko charts are the same. The Renko charts are the same because the bars only reflect the price movement and not the time duration that it took for the prices to raise above or below the range fixed by the bar size.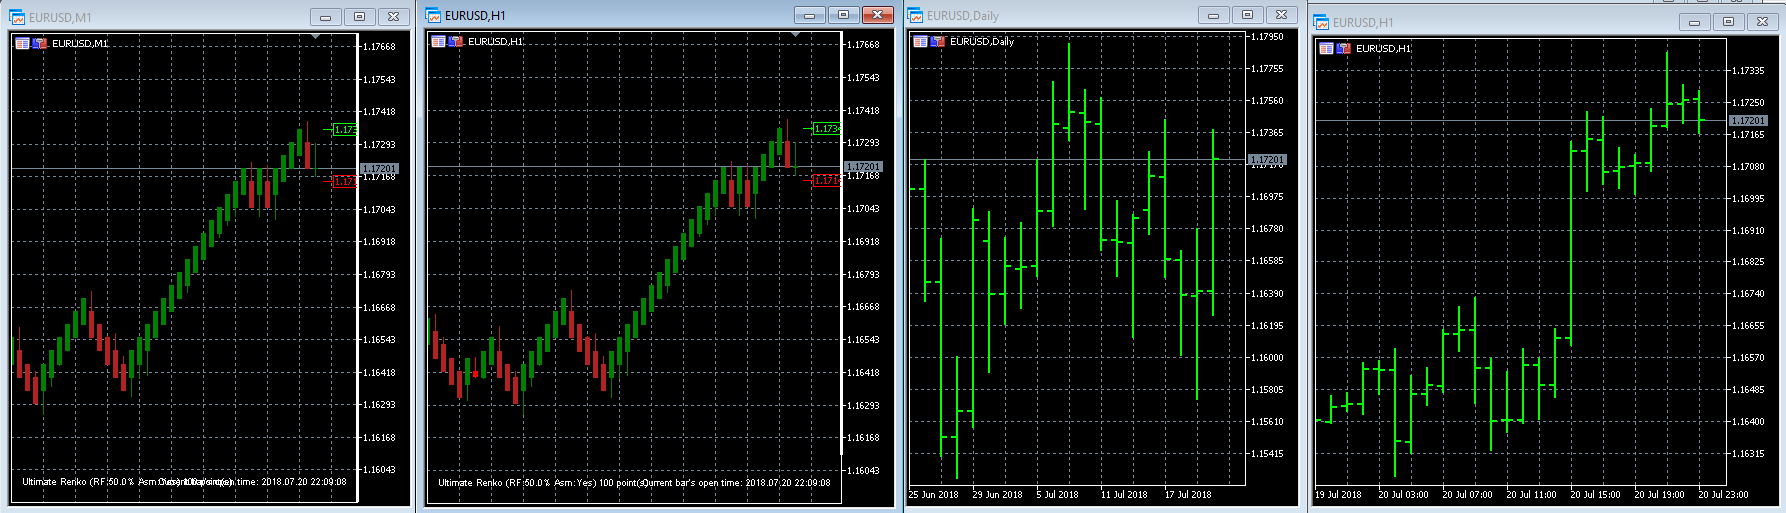
Hi, see the image above, it's a renko chart, you know that before the price was 11, it was 10. If there is no time element, you could never say that the price was 10 before reach 11. Do you think the word "before" counts as time based on events instead of the clock or not?
NO.
The brick before was the previous X pips brick.
And the next brick will be the next X pips.
The when was deliberately removed from the equation.
Please show the equation or stop adding alien elements to it.
You are over complicating a simple concept.
I see, maybe the problem is english language, i think it's interesting because it shows that different languages make people think differently. To me it's clear that renko uses time based on events, just like when i say: "yesterday night", i'm talking about time, but not clock time
I see, maybe the problem is english language, i think it's interesting because it shows that different languages make people think differently. To me it's clear that renko uses time based on events, just like when i say: "yesterday night", i'm talking about time, but not clock time
The problem is not the English language.
The problem is you not understanding simple concepts.
- Free trading apps
- Over 8,000 signals for copying
- Economic news for exploring financial markets
You agree to website policy and terms of use