- No need for the decrement. Contradictory information on IndicatorCounted() - MQL4 and MetaTrader 4 - MQL4 programming forum
- You should stop using the old IndicatorCounted and start using the new Event Handling Functions - Functions - Language Basics -
MQL4 Reference
How to do your lookbacks correctly. (dist) - Bars are numbers zero (current) increasing (past.) Your i-dist/2 is looking at future bars.
- No "yellow highlighted text."
thank you, whroeder, for your reply
I'm a discretionary trader, using several rules, in my mind not written in any programming language... my programming skills are next to zero level... so, I've read, and will read again the link you've put on
I think to have undestood the meaning of the counted bars
But what do you mean when you say "i-dist/2 is looking at future bars"?
if, for example, dist = 10, I understand that the " hhb=Highest(NULL,0,MODE_HIGH,dist,i-dist/2);" is the highest level between the last 10 bars, or the last 5 (10/2), after the indicator had been launched last… is it wrong?
Hoping to have explained my thought
Yes.
For bar 10, it looks at bars [14..5]. For bar 5 it looks at bars [9..0]. It uses future bar values for a specific bar output. Wrong.
For bars 4 to zero it fails. The future does not exist.
Sorry me,
I like this indicator very much, if used with other indicators or instruments (for example, pivot, Fibonacci retracements, etc)
I'm not clear yet… probably, it will be clear with the help of a chart… I've set 'dist' value at 10...
can you explain me only the last two 'up arrow', please?
Many thanks again, for your patience
I think to have understood!!
I have tried several set values, it's a sort of swing indicator, with needs confirm during the next "dist/2" bars after the signal… is it right?
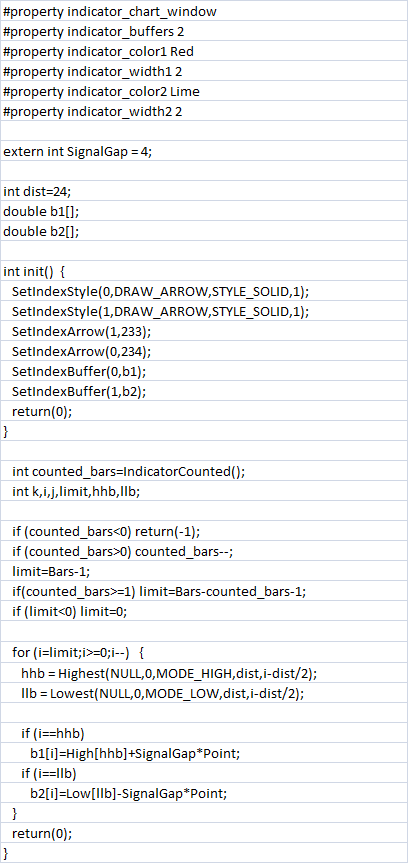
can anyone help with solving the formula from code below,,how it actually works ,, i want to understand its calculations in excel sheet or if anyone can help to solve it..

| #property indicator_chart_window |
| #property indicator_buffers 2 |
| #property indicator_color1 Red |
| #property indicator_width1 2 |
| #property indicator_color2 Lime |
| #property indicator_width2 2 |
| extern int SignalGap = 4; |
| int dist=24; |
| double b1[]; |
| double b2[]; |
| int init() { |
| SetIndexStyle(0,DRAW_ARROW,STYLE_SOLID,1); |
| SetIndexStyle(1,DRAW_ARROW,STYLE_SOLID,1); |
| SetIndexArrow(1,233); |
| SetIndexArrow(0,234); |
| SetIndexBuffer(0,b1); |
| SetIndexBuffer(1,b2); |
| return(0); |
| } |
| int counted_bars=IndicatorCounted(); |
| int k,i,j,limit,hhb,llb; |
| if (counted_bars<0) return(-1); |
| if (counted_bars>0) counted_bars--; |
| limit=Bars-1; |
| if(counted_bars>=1) limit=Bars-counted_bars-1; |
| if (limit<0) limit=0; |
| for (i=limit;i>=0;i--) { |
| hhb = Highest(NULL,0,MODE_HIGH,dist,i-dist/2); |
| llb = Lowest(NULL,0,MODE_LOW,dist,i-dist/2); |
| if (i==hhb) |
| b1[i]=High[hhb]+SignalGap*Point; |
| if (i==llb) |
| b2[i]=Low[llb]-SignalGap*Point; |
| } |
| return(0); |
| } |

- 2018.07.18
- www.mql5.com
- Free trading apps
- Over 8,000 signals for copying
- Economic news for exploring financial markets
You agree to website policy and terms of use
Hi all,
I'm writing because I would like to understand what activates the signals of buy and sell of an indicator… is there anyone who has the patience to explain to me the yellow highlighted text? Attached is the file of the indicator from which I extracted the part that I can't understand.
Many thanks