Gold / XAUUSD / GC_F Discussion and Analysis - page 3
You are missing trading opportunities:
- Free trading apps
- Over 8,000 signals for copying
- Economic news for exploring financial markets
Registration
Log in
You agree to website policy and terms of use
If you do not have an account, please register
Gold winding tighter as C7 anticipates a breakout...
MetaTrader Trading Platform Screenshots
GOLD, H1, 2014.05.16
Gold H4 ready to buy short-term Take advantage 1303.49 and if continues to rise 1307.27 targeting 1287.74 and stop loss
Forum on trading, automated trading systems and testing trading strategies
Press review
newdigital, 2014.05.17 11:33
GOLD Fundamentals (based on dailyfx article)
Fundamental Forecast for Gold: NeutralGold prices are marginally higher this week with the precious metal inching up 0.18% to trade at $1291 ahead of the New York close on Friday. Bullion has held a tight range for some time now and while our immediate bias remains neutral, a clear setup presents itself as we head into next week with the technical outlook warning of a possible near-term break in gold prices.
Broader market sentiment remains uneasy heading into the weekend with all three major stock indices closing markedly lower on the week as the yield on the US 10Yr dropped to its lowest levels since October 2013 at 2.47%. The key data print came on Thursday with the US consumer price index showing an uptick in both m/m and y/y core CPI. The data could begin to undermine the Fed’s dovish tone and with the labor market recovery seemingly on proper footing, the inflation outlook is likely to remain central focus for the central bank moving forward.
Looking ahead to next week, the release of the minutes from the April FOMC policy meeting will be central focus as investors continue to search for clues as to the central bank’s outlook on interest rates. Highlighting the economic docket next week will be an update on the housing market with existing homes sales on Thursday and New home sales on Friday. Data on Friday showed housing starts jumped 13.2% m/m in April, far surpassing expectations for a gain of just 3.6% m/m and strong data next week could further weigh on gold as prospects for policy normalization from the fed begin to take root. Existing home sales are expected to rise by 2.1% m/m after a 0.2% contraction in March with consensus estimates calling for new home sales to jump by 10.6% m/m, rebounding from a contraction of more than 14% the previous month.
From a technical standpoint, gold has continued to trade into the apex of a multi-week consolidation pattern off the April highs and a break-out ahead of the May close is in focus. A break below 1260/70 is needed to put the broader bearish trend back into play targeting $1216/24 and the 2013 lows at $1178. Interim resistance and our near-term bearish invalidation level stands at $1307/10 with a move surpassing $1327/34 shifting our broader focus back to the long-side of gold. Bottom line: look for a decisive break of this pattern next week with a move surpassing the May opening range to offer further clarity on our medium-term directional bias. The broader outlook remains weighted to the downside sub $1334.
Forum on trading, automated trading systems and testing trading strategies
Press review
newdigital, 2014.05.18 06:18
Gold Is Not Stable After All
I like gold. My wedding ring is simple but classy. My crowns in my mouth are so good that I forget they are there. The electronic contacts in my computer work just fine. Gold is great. But not as a steady measure of purchasing power, nor as a guaranteed investment.
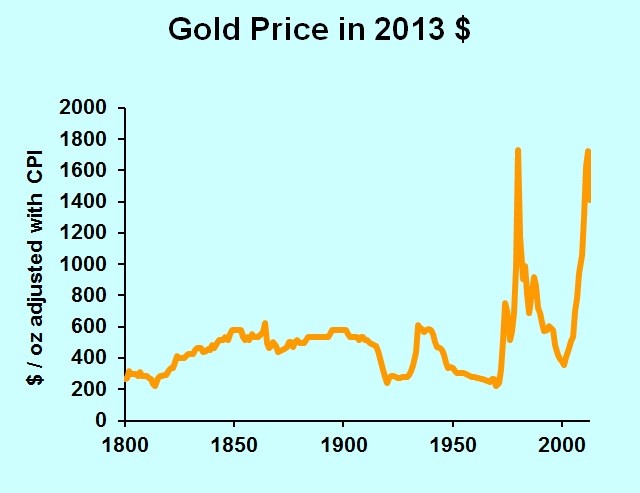
“Gold has the same purchasing power today that it had in 1913,” I continue to read. So let’s look at the data and see what we can conclude about gold, its stability and purchasing power, and then we’ll turn to gold as an investment.
To get an idea of the purchasing power of an ounce of gold, we’ll adjust the gold price by the Consumer Price Index. (I’ve noted elsewhere that Long-term Inflation estimates are misleading, but they are what we’ve got. Just keep in mind that your purchasing power has risen more than the CPI indicates.)
The chart shows a fairly steady price of gold for most of our history, followed by two giant spikes. We’ll get to the spikes later, but let’s narrow in on the seemingly steady period. It turns out that the era from 1800 through 1972 looks steady because those spikes require the chart’s vertical axis to be up at $2000.
If you had bought gold in 1800, you would have increased your purchasing power by 13 percent in five years. That’s not quite a stable measure of purchasing power, but given the accuracy of our price statistics, it’s in the ballpark. As an investment however, note that 13 percent over five years is lousy when interest rates are six to seven percent per year, as they were back then.
Pity, though, the person who bought gold in 1805. In nine years, his gold had lost 26 percent of its purchasing power. Gold was neither a stable measure of value nor a good investment.
The next few decades were good for gold owners. The gold price was steady while consumer prices fell. From the 1814 low until the start of the Civil War, the purchasing power of an ounce of gold more than doubled.
The inflationary years of the Civil War showed gold’s value in a time of crisis. Consumer prices rose 74 percent from 1861 through 1864, but the price of gold doubled.
Now let’s fast forward to the two spikes in the gold price series. In 1980, gold averaged $613 an ounce, though on the best day it traded at $850. By 1982 gold was trading the low $300s. It turns out that the Federal Reserve got serious about fighting inflation just as investors got serious about using gold to hedge against inflation. Ouch.
Then we had another run-up in 2011-12, with gold hitting a daily high of $1,781. As I am writing, May 15, 2014, gold is trading at just under $1,300, off 27 percent from its peak of a few years ago.
Instead of belaboring the data, let’s just say that gold’s value goes up and down. It is not a steady measure of value or purchasing power. Like all other assets, its value is not intrinsic; it has value only as people are willing and able to pay for it. That willingness and ability come and go, and thus gold’s value will rise and fall in the future.
gold at monthly pivot.
200-300pip movement just about the corner. prepare :)
+250pip to be exact
For lovers of gold.
On the weekly chart is very clearly visible reduction of gold at 1060-1030. Around the end of July beginning of August to see the level of traders and if nothing changes in the medium term may be included in the calculation of Long in 1612.