Libraries: The Moving Average Class
Getting Started with Moving Averages
- MVAs show the average price of a currency for a specific number of periods
- As price moves so will the indicator, giving clues about the current market
- Traders can filter a trading decision based on the position of price relative to a MVA
Simple Moving Averages (MVAs) consist of some of the most versatile and
widely used indicators in the market. Typically MVAs are used for
filtering the trend, support and resistance levels, as well as market
entries. Today we will continue our look at indicators by reviewing one
of these components to get you comfortable using MVAs in your trading
strategy. Let’s get started!
MVAs and the Trend
First you may be asking, “What is a moving average?” Moving averages are
simple technical tools that are designed to measure the average price
presented on a graph for a designated number of periods. For example the
200 period MVA is shown below. This means that the closing price has
been taken for the last 200 periods, added them together then finally
divided that sum out again by 200. Once this number has been
established, the average is printed on the graph as a frame of
reference.
Below we can see a USDCAD daily graph with price trending downward. You should notice as price trends downward, the MVA will begin moving lower as well. With price moving down faster than the 200 period MVA this is a strong signal that the market is declining.Likewise as price moves upward, the average will slowly move towards higher highs as well. Knowing this, we can now work the MVA into our trading.

Trading with a MVA Filter
Once a 200 period MVA has been added to your chart, you can easily
decipher whether you should be considering a buy or sell position. The
best trading environment for new buying positions would be in an uptrend
as price moves towards higher highs, while the currency pair stays
above the 200 MVA. The example below shows opportunities to buy the
EURUSD as it rallies above the average. Since the trend is up, at no
time should traders consider a sell based position!
This bias abruptly changes when prices move below the designated 200 period MVA. Since the price on this USDCAD daily chart is below the average traders should at no point consider new positions buying the pair. As price moves towards lower lows and stays below the average, only new sell positions should be considered. Now that you have filtered for the trend, you can focus your attention to timing new entries with the market!

Trading with MVAs
Filtering for the trend is just one of three key ways you can utilize the Moving Average in your trading!
Three Ways to Trade with Moving Averages
- Traders can use mathematical averaging to their advantage by employing the moving average.
- Moving averages can be used to initiate positions in the direction of the trend.
- Traders can incorporate multiple moving averages to fit in their strategy to accomplish specific goals.
Indicators can be tricky tools. Knowing which ones to use and how to use
them can be complicated enough; but finding out how to properly employ
an entire strategy in the right market environment can be the most
difficult question for traders to address.
The Moving Average is simply the last x period’s closing prices added
together, and divided by the number of observed periods (x). And it’s in
its simplicity lies its beauty. When prices are trending higher, the
moving average will reflect this by also moving higher. And when prices
are trending lower, these new lower prices will begin to be factored
into the moving average and it too will begin moving lower.
While this averaging effect brings on an element of lag, it also allows
the trader an ideal way of categorizing trends and trending conditions.
In this article, we’re going to discuss three different ways this
utilitarian indicator can be employed by the trader.
As a Trend-Filter
Because the moving average does such a great job of identifying the
trend, it can be readily used to offer traders a trend-side bias in
their strategies. So if price action is above a moving average, only
long positions are looked at while price action below the moving average
mandates that only short positions are taken.
For this trend-filtering effect, longer-term moving averages generally
work better as faster-period settings may be too active for the desired
filtering effect. The 200 Day Moving Average is a common example, which
is simply the last 200 day’s closing prices added together and divided
by 200.
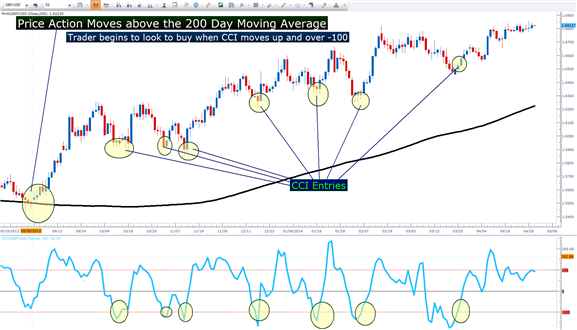
After a bias has been obtained and traders know which direction they
want to look to trade in a market, positions can be triggered in a
variety of ways. An oscillator such as RSI or CCI can help traders catch
retracements by identifying short-term overbought or oversold
situations.
In the picture below, we show an example of a CCI (Commodity Channel Index) Entry with the 200 day moving average as a trend filter.
As a trigger to initiate positions
Taking the idea of strategy development a step further, the logic of the
moving average can also be used to actually open new positions.
After all, if price action is showing a trending state just by residing
above a moving average, doesn’t logic dictate that the very action of
crossing that moving average can have trending connotations as well?
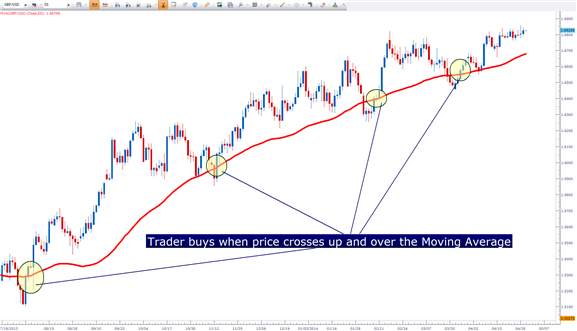
So traders can also use the price/moving average crossover as a trigger into new positions, as shown below.
The Moving Average can also be used to initiate positions in the direction of the trend
The downside to the moving average trigger is that choppy or trend-less
markets can invite sloppy entries as congested prices meander back and
forth around a specific MA. So it’s highly suggested to avoid using a
moving average trigger in isolation without any other filters or
limitations. Doing so could mean massive losses if markets congest or
range for prolonged periods of time.
As a Crossover Trigger
The third and final way that moving averages can be implemented is with
the moving average crossover. This is an extremely common way of
triggering trades, but has the undesired impact of being especially
‘laggy’ by introducing two different lagging indicators rather than just
one (as is the case of using the MA as a filter or a trigger
individually).
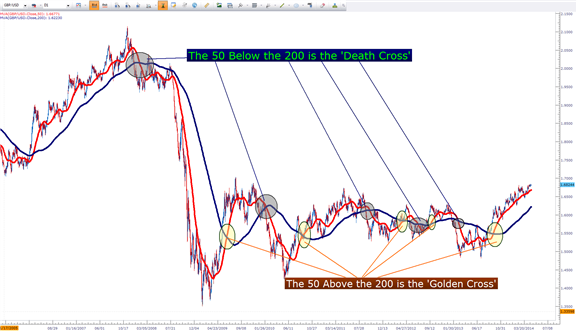
Common examples of moving average crossovers are the 20 and 50 period
crossovers, the 20 and 100 period crossover, the 20 and 200 period
crossover, and the 50 and 200 period crossover (commonly called ‘the
death cross’ when the 50 goes below the 200, or the ‘golden cross’ when
the 50 goes above the 200).
The 50 Day/200 Day Moving Average Crossover :
This can be taken a step further with multiple time frame analysis.
Traders can look to a longer-term chart to use a moving average filter
as we had outlined in the (1) part of this article, and then the
crossover can be used as a trigger in the direction of the trend on the
shorter time frame.
While no indicator is going to be perfect, these three methods show the
utility that can be brought to the table with the moving average, and
how easily traders can use this versatile tool to trigger trades ahead
and in front of very large, outsized moves in the market.
Forum on trading, automated trading systems and testing trading strategies
newdigital, 2014.06.05 09:41
USDCHF Breakout Hindered by 200-Day Moving Average (adapted from dailyfx article)
- The USDCHF break has run into the 200 Day Moving Average.
- Potential buyers could enter upon a confirmed break above the 200 Day MA.
The 200-Day Simple Moving Average
The 200-Day Simple Moving Average is one of the most popular indicators
in the world. When price breaks through a 200 MA on a daily chart, it
can often be seen as a topic of conversation on financial news stations,
websites and newspapers.
It is primarily used to give traders and investors an overall sense of how strong or weak a currency pair is.
Typically, when a currency pair’s price falls below the 200 Day MA, it
is a sign of weakness with a potential for further price decline. And
when a currency pair’s price breaks above the 200 Day MA, it is a sign
of strength with a potential for further price increases.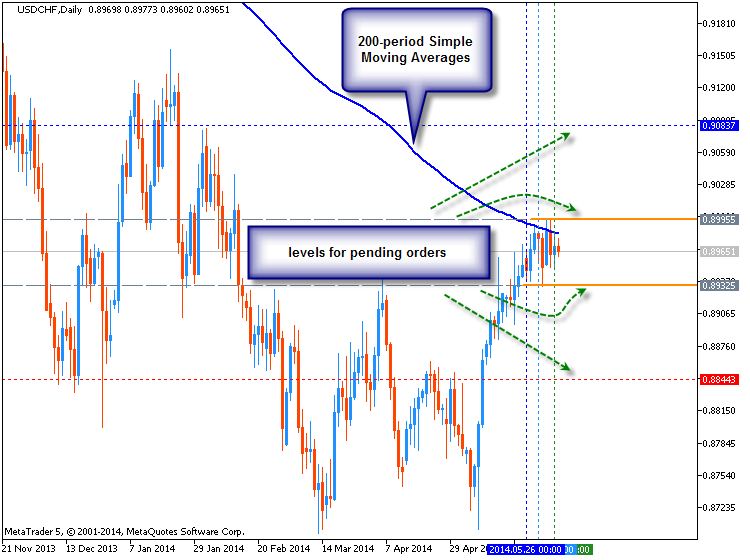
The chart above shows the recent price action surrounding the 200 Day
MA. We see a large run up in price breaking through multiple resistance
levels until it met this powerful MA line. We have had 6 consecutive
days where price has temporarily broke through the 200 Day MA or price
has come within 10 pips of the line before retreating lower. So this
level is acting as strong resistance.
If price were to remain below the MA, it could propel it lower back into
the pair’s price channel. However, a breakout to the upside could add
yet another reason to buy the USDCHF. Until we witness a larger price
move, we are in a state of limbo.
- Free trading apps
- Over 8,000 signals for copying
- Economic news for exploring financial markets
You agree to website policy and terms of use
The Moving Average Class:
Uses the idea of the classical moving average smoothing. The class can be used when you want to smooth out any array of type double without using the standard indicator.
The class sample requires the following:
An example of using the class is available in the indicator line.mq5
Author: Ekaterina Hinkel