Forum on trading, automated trading systems and testing trading strategies
Should i move from MQL4 to MQL5 ?
Alain Verleyen, 2015.12.04 11:20
Yes it can. iMAOnArray() is obsolete and ineffective, replace it with calls to functions from MovingAverages.mqh library (standard with MT4, provided in Include folder).here it is:
 int shift,limit = cbars;
  if(limit==0) limit = Bars;
  for(shift=limit-1; shift>=0; shift--) {
      RsiBuf[shift] = iRSI(NULL,0,Rsi,PRICE_CLOSE,shift);
      }
  for(shift=limit-1; shift>=0; shift--) {
      // First Indicator Data
      MaF[shift] = iMAOnArray(RsiBuf,0,Ma,0,MODE_SMA,shift);
}
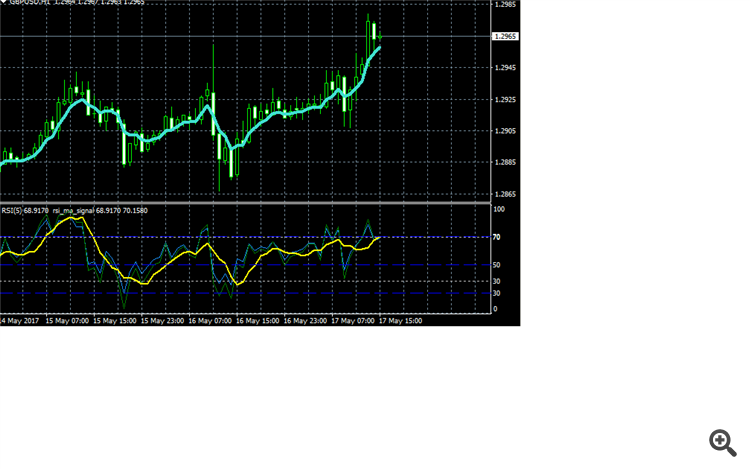
but in this way I have a MA in RSI like this:
yellow line. I do not want this..... I want a MA line like Turquoise one but on top of RSI graph for checking when this MA touch levels 70 and 30.
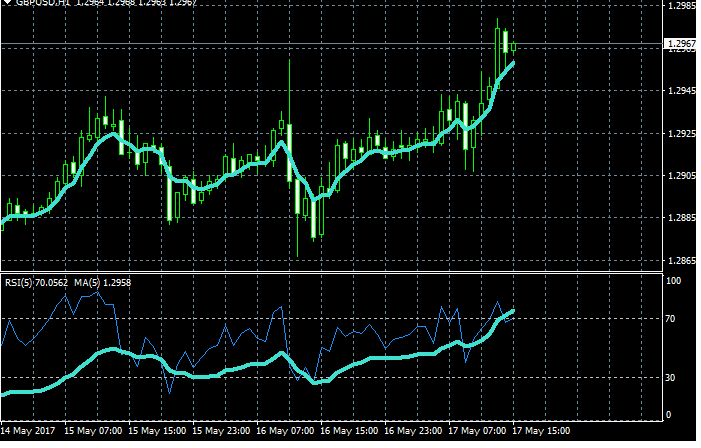
Manually I obtain this result by dragging&dropping MA on RSI with Apply to: First indicator's data, and when it is on graph but modifying it choosing apply to: Close. Here the result:

Do you see? The 2 lines are more or less identical?
How can I have this result programmatically?
Thanks
Some help ?
Thanks to all
there's no direct solution for ur question. iMAOnArray can't apply in close price, because close price means ur data input for iMAOnArray must be an MA data too.
but there's a trick to do that.
let me give u some example in my indicator:
int OnStart()

{

int counted_bars=IndicatorCounted();

int limit = Bars-counted_bars-1;

   for(int i=limit; i>=0; i--)  dataLowMA[i]    = iMA(NULL,0,periodLowMA,0,MODE_EMA,PRICE_CLOSE,i);

   for(int i=limit; i>=0; i--)  dataHighMA[i]    = iMA(NULL,0,periodHighMA,0,MODE_EMA,PRICE_CLOSE,i);

   for(int i=limit; i>=0; i--) MA5[i]           = iMAOnArray(dataLowMA, 0,  periodLowMA,  0, MODE_EMA, i);

   for(int i=limit; i>=0; i--) MA12[i]          = iMAOnArray(dataHighMA, 0, periodHighMA, 0, MODE_EMA, i);

//----

return(0);

}
- Free trading apps
- Over 8,000 signals for copying
- Economic news for exploring financial markets
You agree to website policy and terms of use

with MT4, I'm trying to create a custom indicator that, once I placed RSI indicator, put on it also the MA indicator.
Manually I add RSI chart indicator, then
1) I drag&drop MA indicator and select Apply to: First indicator's data and then I click OK.
2) Then I reopen in editing this MA and change Apply to: Close.
I've written the indicator using iMAOnArray function but it displays the MA as 1). I need to change to 2). How can I do?
Thanks