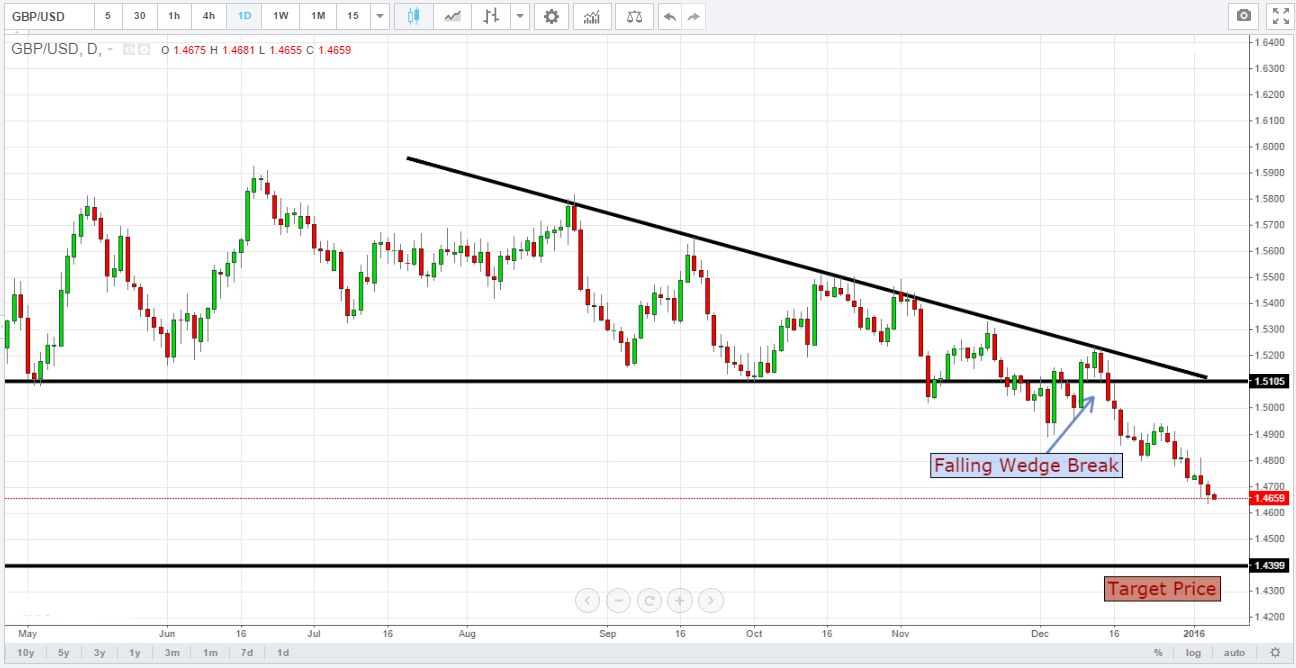
 i agree to your view and even i did analysis on my side with might add up to the view here. There is a falling wedge formation on the charts and most of the indicators are showing its signal of Strong Sell.
Please add your views
Files:
image_194522.png
98 kb
You are missing trading opportunities:
- Free trading apps
- Over 8,000 signals for copying
- Economic news for exploring financial markets
Registration
Log in
You agree to website policy and terms of use
If you do not have an account, please register
GBPUSD: Having GBP continued to hold on to its downside pressure, it leaves risk of more weakness on the cards. Support lies at the 1.4700 level where a break will turn attention to the 1.4650 level. Further down, support lies at the 1.4600 level. Below here will set the stage for more weakness towards the 1.4550 level. Its daily RSI is bearish and pointing lower suggesting further weakness. On the upside, resistance stands at the 1.4800 level with a turn above here allowing for more strength to build up towards the 1.4850 level. Further out, resistance comes in at the 1.4900 level followed by the 1.4950 level. On the whole, having GBP continued to remain weak and vulnerable to the downside, it leaves risk of more weakness on the cards.