Advanced trading lessons - page 2
You are missing trading opportunities:
- Free trading apps
- Over 8,000 signals for copying
- Economic news for exploring financial markets
Registration
Log in
You agree to website policy and terms of use
If you do not have an account, please register
trend lines are traps
trend lines are traps even if momentum goes in your favor at the third point of the
trend line price always comes back at near or above where your entry is at that point.
so if you lock your self into profit you get kicked off the market. with small win.
or worse just plain stopped out with loss.
this is the third point on trend lines.
this happens on all time frames, even the yearly time frames, this is the clock that moves called trading.
if you can't learn this you will never trade successful.
the market if it wants to trend, it has to move fast and unexpectedly at times ( inner slopes )
then slowing down to trap traders and confuse them at others. then the trend can make money as it moves!!!
their i said it the market is designed to collect money as it moves!!
trend lines and time
now passing trend line from time frame to time frame is a trick rather than a treat.
some times ranges last longer then traders expect, we will see a shot where we finally broke the trend line
on the one hour outer slope trend line, and just then the days trading ended, so the next time frame slope
would be the daily, skipping over the four hour time frame.
so knowing when the:
four time frame opens
the new day opens
the weekly opens
the monthly opens
the yearly opens
these are all considerations for slope of that time frame.
the range of markets are not what every one talks about, range calculators etc. junk use your heads
there are no average ranges!! ranges change from large , medium. and small. almost 99.9% of range candle
over lap to some degree. picking out ranges in advance of a time frame takes knowledge of the markets.
thinking this could be new inner slope, or we could move sideways here to hit the upper time frame for physical
strike. knowing what the market does with price action psychology is critical.
who cares if you know an average range. it does not help you.
what you need to know is what is the top of the range in down trend at the next Time periods open.
asking yourself what time frame was just crossed is the clue!!!
if we just crossed the daily time frames trend line and a new week is just about to open, then
we are far and above more than likely going to have several days of ranging before making
a new high range for the week, weekly spinning top. most likly
if just finally crossed the four hour time frame just before the new week opens then we are more likely
to get ranging on the four hour trap off the highs then the new down week going strong. trending candle
this is Time , trend lines, and ranges all being explained, in the only way they should be explained, everything
else is just garbage.
we work more with ranges later.
identifying strength and weekness
we get classes and advice from lots of sources about how to identify strength and weakness in markets.
we here things like this: weak ranging markets lead to strong trending markets... witch is true
we here things like this: strong markets are likely to continue..... this is true also
i will add this
also a week market is likely to get weaker after faking re-joining strength ... this is true ( trap)
also a strong market is likely to fake new strength faking re-joining strength... this is true (trap)
so how do you know what to believe if all 4 are true.
this why trend lines are so important, we use trend line to gauge true strength and weakness from
the fake strength and weakness.
in the next lesson we will take what we learned from the first trend line lesson and apply identifying
the truth from fiction.
advertised closing
each time frame have it's own weakness
the higher freq you go up the more of that weakness is hidden from view, or filtered out
as traders say, so in order to see the weakness in the recent past traders have to lower
their freq.
so each time frame has its own counter trends ranges.
these ranges on the weekly can be nice 4 hour swings.
the ranges on the daily can be nice 30 minute swings.
an easy way to know a range is going to start before anyone else knows it will is this
simple trick. i call it an((advertised closing!!))
advertised closing
this is an example of an advertised close, that can give you a clue as to when the market
may start ranging, in advance before the market actually does.
in order to take advantage of a ranging market advertised close you must lower you freq. by
two time frames first.
you see for the market trend to continue, once it crosses the trend line it must range sideways
to get away from that trend line before continuing.
it also can do one other thing: break the trend line slightly then climb back inside the trend line
immediately.
we will sort out the differences later, but for now, you have learned to identify weakness in the
market before any one else can.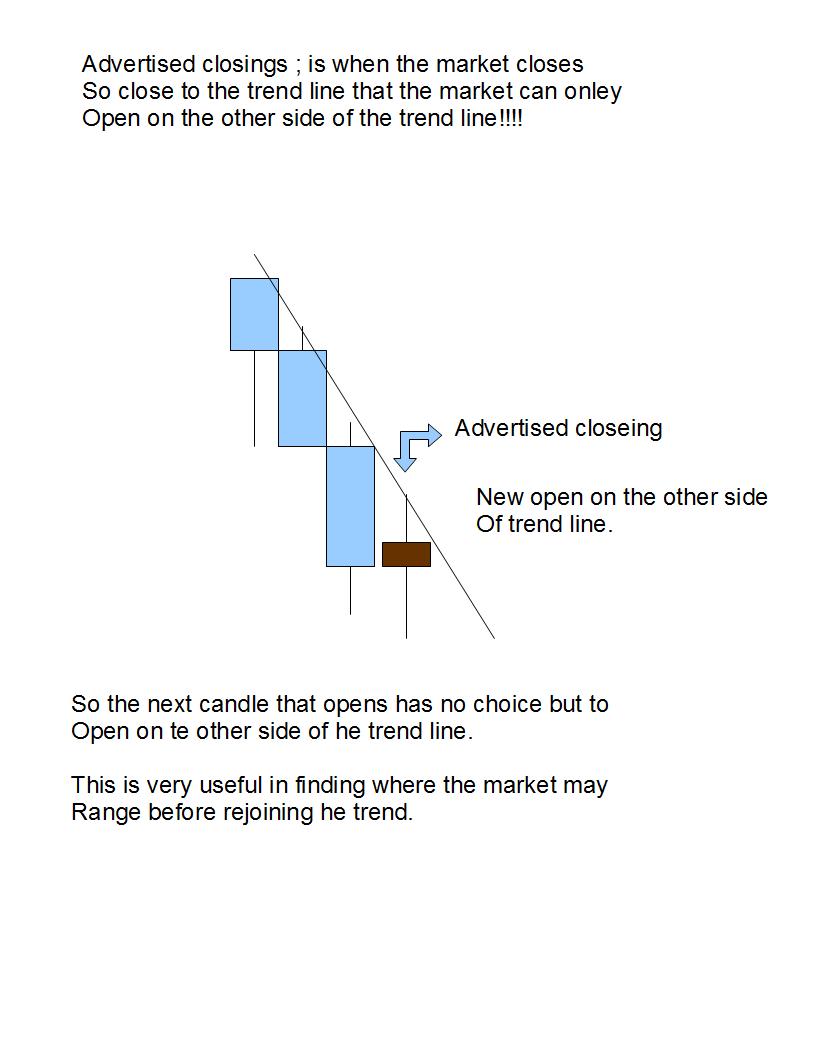
advertised closing example
advertised close tips off new range!!! next we look at how we take advantage of this new range.
taking advantage
there are two ways i take advantage of the new range, i know this way before it starts.
the first way is to buy counter trend at support off the back side of the trend line.
target above the candles high that had that advertised close. i like to see a trap
on a lower freq. at that level first.
then above the high of the advertised close candle i sell, but again i want to see a trap
on a lower freq at that level.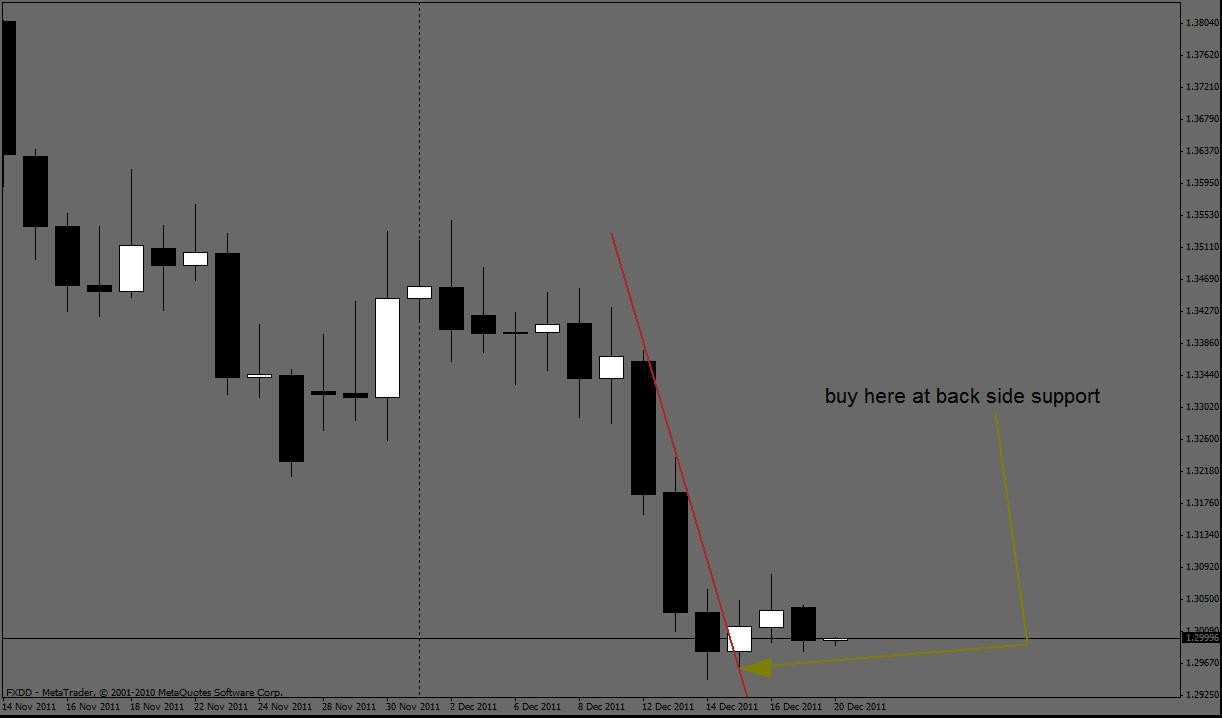
the lower freq trap
now this is daily chart, so jump down at least two time frames to find the trap. sometimes lower
well but has to be at least two. this trap was at the 15 minute time frame!
but what we are looking for is a candle defiantly saying keep short near this level.
and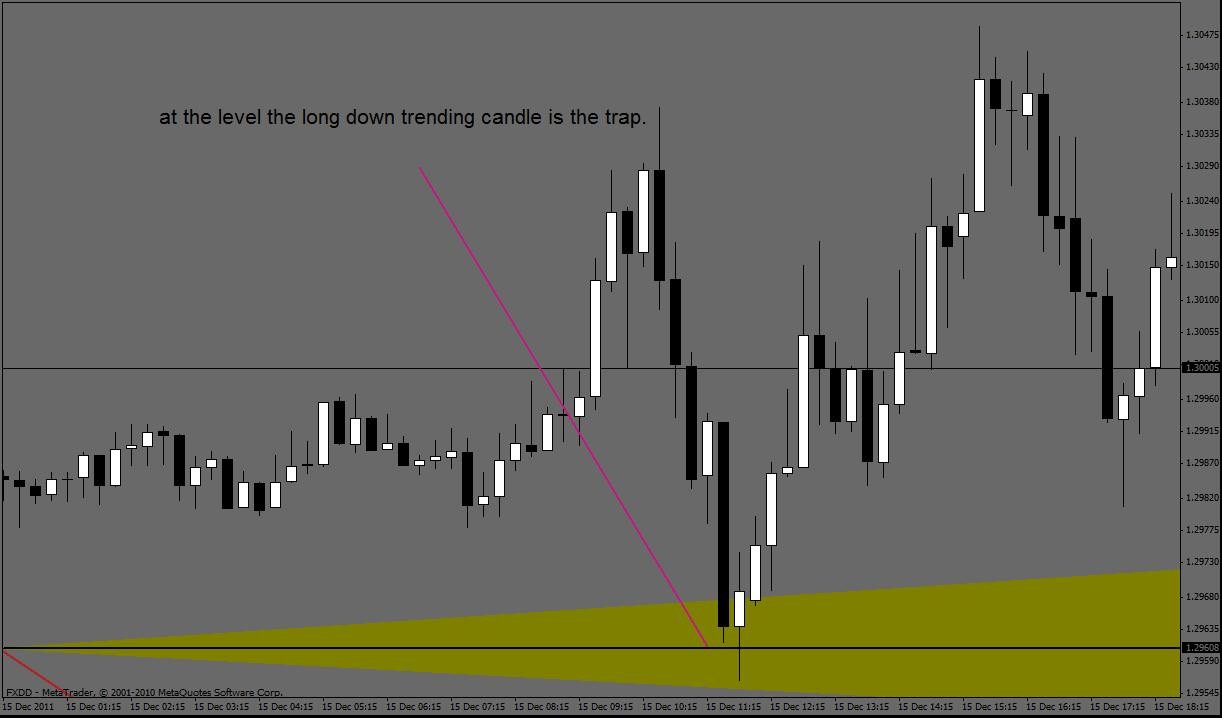 here it is:
notice the arow and t.l.
the arrow and the trend line are behind where price hit at the level. remember before
i showed you how a trade can work forward in time using data transfer, well guess
what a trade can work backwards in time also, even though price physically did not
hit the back side of the trend line on the 15 minute time frame, it did on the daily time frame!!
see how the secret works?
its not that hard really
all i am doing is laying higher time frame trend lines on top of lower freq. charts.
drawing trend lines, entering the trend on physical strikes of that trend line.
or trading ranges using advertised closes.and looking at price action psychology
trapping traders for confirmation.