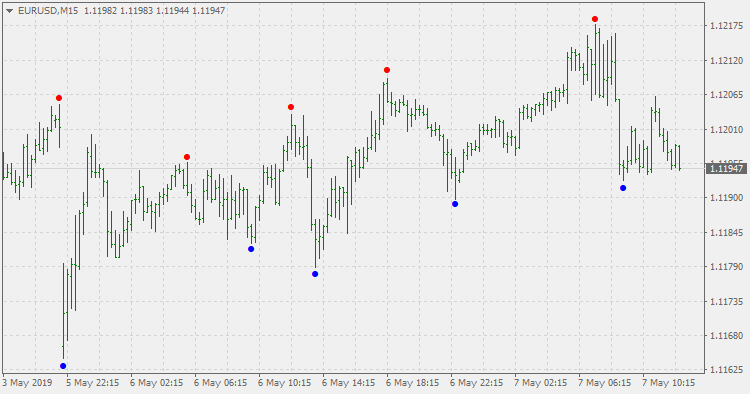
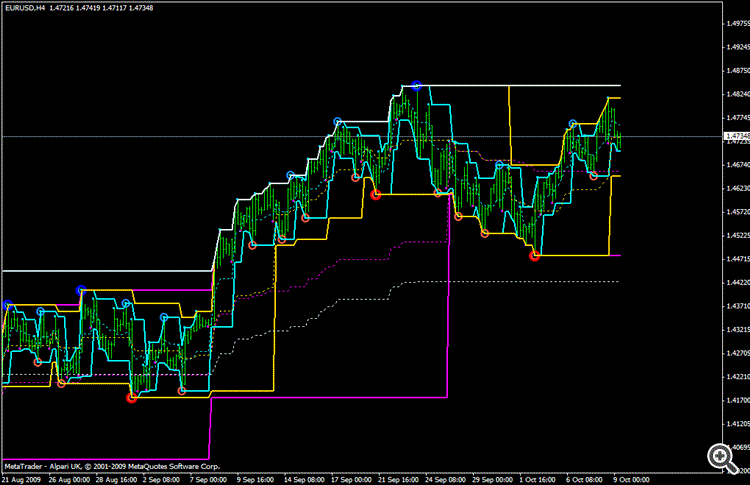
Multi-Dimensional Fractals (up to 4 Dimension) give us market structure with different kinds of supports and resistances.
Just some words about market structure from Larry Williams "LONG-TERM SECRETS TO SHORT-TERM TRADING":
"Why This Is Important
Once you have this basic understanding of market structure you can identify, very early on, these
market turns. You will always know that a short-term low has been made when you rally above the high of
a day with a lower low than the prior day. By the very nature of this penetration, we know the short-term
down swing has terminated. By the same token, whenever price declines below the low of a day with a
higher high than the prior day, a short-term high has been formed. This means we can know, during the
trading session, when these points are established.
As short-term traders, we also can tell when intermediate-term highs and lows are made. How?
Simple, if the formation of a short-term high will confirm an intermediate-term high, which in turn
confirms a long-term high, we can get in at some optimal turning points.
It is really all about nesting swings together, fitting the pieces of the puzzle into their proper place,
to give us an understanding of the structure of market activity. The beauty is you can now identify, at
all times and for all markets, whether the trend (based on price structure) is up or down and pick your
points to get in and out.
For years, I made a pretty good living using just the formation of these points as buy and sell
entries. These points are the only valid support and resistance levels I have ever found. They are highly
significant and the violation of these price points provides important information of trend and trend
change. Thus I can use them for my stop-loss protection and entry techniques."i must say you come up with some of the greatest indicators i have seen in my entire time learning and researching forex this also looks like something i could use so i will test it and post some results of anything that i come up with for you
Hi Igorat,
TQ for the indicator. I have few questions.
1. Does the circles repaint ?
2. How much time lag before the circles appeared ? I traded on 1H and i think it took 2-3 bars after before the circles appeared.
Thanks
KL
.............
You will always know that a short-term low has been made when you rally above the high of a day with a lower low than the prior day. By the very nature of this penetration, we know the short-term down swing has terminated. By the same token, whenever price declines below the low of a day with a higher high than the prior day, a short-term high has been formed.
How about you make an indicator that simply shows this pattern on the chart:
rally above the high of a day with a lower low than the prior day: blue circle
decline below the low of a day with a higher high than the prior day: red circle
Fractal Dimension Index
Forum threads
- Fractal dimesion index - jppoton indicator is on this post. Although this jppoton's version is using Alex Matulich calculation as the closest to original, this version (jppoton's version) deviates from original Sevcik and Matulich version and ultimately from Hurst exponent (FDI = 2- Hurst), and it made his version to be faster than FGDI. So, the story of Fractal dimension index is a rather old one and it seems that it will never end.
- Fractal dimesion index pa - jppoton indicator and Fractal dimesion index alb - jppoton indicator are on this post. Here is the adaptive look back version and also the phase accumulation version of Fractal dimesion index pa - jppoton indicator. Just to remind: the adaptive Lookback (period finder) is truly a market-driven indicator used to determine the variable lookback period for many different indicators, instead of a traditional, fixed figure; and phase accumulation idea is to find how many bars does it take to add up every bars phases and to reach certain cycle.
The articles
- Fractal Analysis of Joint Currency Movements
- Calculating the Hurst exponent
- ZUP - universal ZigZag with Pesavento patterns. Graphical interface
CodeBase
- Fractal Graph Dimension Indicator (FGDI) - indicator for MetaTrader 4
- Fractal dimension - indicator for MetaTrader 4
- Fractal Dimension Index - indicator for MetaTrader 5
- Fractal Dimension Index. + Step EMA - indicator for MetaTrader 4
- Creating fractals in MQL5 using the Iterated Function Systems (IFS) - expert for MetaTrader 5
- Fractal Bands - indicator for MetaTrader 4
- Fractal Adaptive Moving Average (FrAMA) - indicator for MetaTrader 5
- FRASMA: Fractally Modified Simple Moving Average - indicator for MetaTrader 4
============
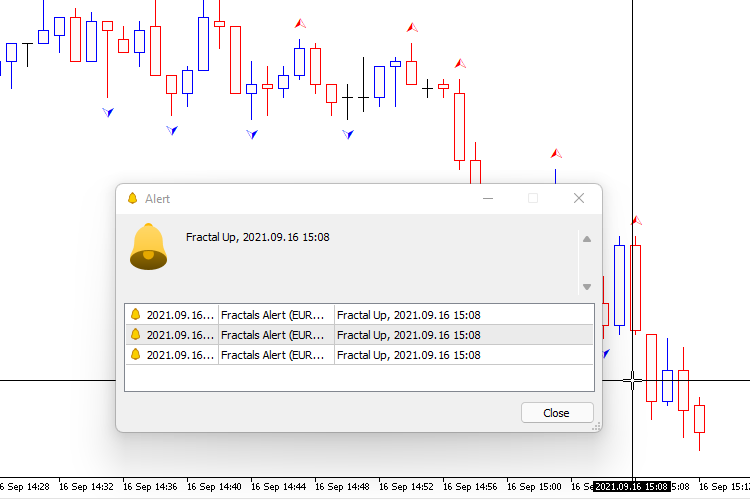
Fractals - adjustable period and prices - indicator for MetaTrader 4

One of the "classics" but with a twist - unlike the built in fractals indicator, this one allows you to :
- adjust the fractals period (the built in fractal indicator is using period 5)
- chose prices for high and low (might be useful in some cases - in extreme whipsaw market conditions, for example)

- 2021.09.16
- www.mql5.com
- Free trading apps
- Over 8,000 signals for copying
- Economic news for exploring financial markets
You agree to website policy and terms of use


Multi-Dimensional Fractals (up to 4 Dimension) give us market structure with different kinds of supports and resistances.
Just some words about market structure from Larry Williams "LONG-TERM SECRETS TO SHORT-TERM TRADING":
"Why This Is Important
Once you have this basic understanding of market structure you can identify, very early on, these
market turns. You will always know that a short-term low has been made when you rally above the high of
a day with a lower low than the prior day. By the very nature of this penetration, we know the short-term
down swing has terminated. By the same token, whenever price declines below the low of a day with a
higher high than the prior day, a short-term high has been formed. This means we can know, during the
trading session, when these points are established.
As short-term traders, we also can tell when intermediate-term highs and lows are made. How?
Simple, if the formation of a short-term high will confirm an intermediate-term high, which in turn
confirms a long-term high, we can get in at some optimal turning points.
It is really all about nesting swings together, fitting the pieces of the puzzle into their proper place,
to give us an understanding of the structure of market activity. The beauty is you can now identify, at
all times and for all markets, whether the trend (based on price structure) is up or down and pick your
points to get in and out.
For years, I made a pretty good living using just the formation of these points as buy and sell
entries. These points are the only valid support and resistance levels I have ever found. They are highly
significant and the violation of these price points provides important information of trend and trend
change. Thus I can use them for my stop-loss protection and entry techniques."