Please fix this indicator or EA - page 29
You are missing trading opportunities:
- Free trading apps
- Over 8,000 signals for copying
- Economic news for exploring financial markets
Registration
Log in
You agree to website policy and terms of use
If you do not have an account, please register
I use a linear regression indicator (i-Regr) in my EA. Specifically, I use the slope of the linear regression.
I define the "slope" like this:
(where CurrentReg is the regression's value at the current bar's close price, and LastReg is the value of the previous bar's close price)
I made an expert advisor that prints a readout of slopes. The relevant statement looks like thiscode looks like this:
When run through the strategy tester on a specific time segment the following results are produced (MT4 console copy/paste):
2011.05.31 23:59 showslope EURUSD,M5: Slope: 30.2633
2011.05.31 23:55 showslope EURUSD,M5: Slope: 30.7395
2011.05.31 23:50 showslope EURUSD,M5: Slope: 30.2577
2011.05.31 23:45 showslope EURUSD,M5: Slope: 29.7591
[/CODE]
I need to modify the indicator to let me to "bar shift" to any bar. For example, a "bar shift" of 1 should have 30.7395 as the last output instead of 30.2633.
Attempting to shift by incrementing the index shift property in the iCustom command does not do what I intend.
I tried to modify the i-Regr indicator to implement the type of "bar shift" that I require.
Here are the changes I made:
[CODE]
1. Commented out SetIndexShift statements
2....
SetIndexDrawBegin(0, Bars-p-1-shift);
SetIndexDrawBegin(1, Bars-p-1-shift);
SetIndexDrawBegin(2, Bars-p-1-shift);
3. Every instance of Close[n]) changed to: Close[n+shift])
I tried calling the modified indicator like this:
[CODE]Print("Slope: ",MathAbs(1000000*( iCustom(Symbol(),0,"i-Regr",1,1,34,shift,0,0)-iCustom(Symbol(),0,"i-Regr",1,1,34,shift,0,1))/Period()));(with shift = 1)
But I got inaccurate output when I tested it on the same timeframe.
[CODE]
2011.05.31 23:59 showslope EURUSD,M5: Slope: 30.5434
2011.05.31 23:55 showslope EURUSD,M5: Slope: 30.5434
2011.05.31 23:50 showslope EURUSD,M5: Slope: 30.0448
2011.05.31 23:45 showslope EURUSD,M5: Slope: 29.8319
I cannot understand why this happens, but I am guessing that it is because I missed something in the i-Regr code. What I want is for the final output to read as it did a bar back: 30.7395 . Instead it repeats an incorrect number twice.
If someone would please look at my modification and help me out with this, I would really appreciate it.
Attached is the original i-Regr indicator and my broken mod.Have you tried just calling the i-Regr unmodified version like this iCustom(Symbol(),0,"i-Regr",1,1,34,Shift,0,0)-iCustom(Symbol(),0,"i-Regr",1,1,34,Shift,0,1) since the shift function is there and with your 3 indicator buffers already don't think you have to modify anything in the indicator, in the Ea can make shift an external parameter to control it.
Have you tried just calling the i-Regr unmodified version like this iCustom(Symbol(),0,"i-Regr",1,1,34,Shift,0,0)-iCustom(Symbol(),0,"i-Regr",1,1,34,Shift,0,1) since the shift function is there and with your 3 indicator buffers already don't think you have to modify anything in the indicator, in the Ea can make shift an external parameter to control it.
I have tried that before, but I tried it again just to make sure. It produces this output (equivalent to un-shifted):
2011.05.31 23:59 showslope EURUSD,M5: Slope: 30.2633
2011.05.31 23:55 showslope EURUSD,M5: Slope: 30.7395
2011.05.31 23:50 showslope EURUSD,M5: Slope: 30.2577
2011.05.31 23:45 showslope EURUSD,M5: Slope: 29.7591
Linear regression shift back
I use a linear regression indicator (i-Regr) in my EA. Specifically, I use the slope of the linear regression.
I define the "slope" like this:
(where CurrentReg is the regression's value at the current bar's close price, and LastReg is the value of the previous bar's close price)
I made an expert advisor that prints a readout of slopes. The relevant statement looks like this:
When run through the strategy tester on a specific time segment the following results are produced (MT4 console copy/paste):
2011.05.31 23:59 showslope EURUSD,M5: Slope: 30.2633
2011.05.31 23:55 showslope EURUSD,M5: Slope: 30.7395
2011.05.31 23:50 showslope EURUSD,M5: Slope: 30.2577
2011.05.31 23:45 showslope EURUSD,M5: Slope: 29.7591
[/CODE]
I need to modify the indicator to let me to "bar shift" to any bar. For example, a "bar shift" of 1 should have 30.7395 as the last output instead of 30.2633.
Attempting to shift by incrementing the index shift property in the iCustom command does not do what I intend.
I tried to modify the i-Regr indicator to implement the type of "bar shift" that I require.
Here are the changes I made:
[CODE]
1. Commented out SetIndexShift statements
2....
SetIndexDrawBegin(0, Bars-p-1-shift);
SetIndexDrawBegin(1, Bars-p-1-shift);
SetIndexDrawBegin(2, Bars-p-1-shift);
3. Every instance of Close[n]) changed to: Close[n+shift])
I tried calling the modified indicator like this:
[CODE]Print("Slope: ",MathAbs(1000000*( iCustom(Symbol(),0,"i-Regr",1,1,34,shift,0,0)-iCustom(Symbol(),0,"i-Regr",1,1,34,shift,0,1))/Period()));(with shift = 1)
But I got inaccurate output when I tested it on the same timeframe.
[CODE]
2011.05.31 23:59 showslope EURUSD,M5: Slope: 30.5434
2011.05.31 23:55 showslope EURUSD,M5: Slope: 30.5434
2011.05.31 23:50 showslope EURUSD,M5: Slope: 30.0448
2011.05.31 23:45 showslope EURUSD,M5: Slope: 29.8319
I cannot understand why this happens, but I am guessing that it is because I missed something in the i-Regr code. What I want is for the final output to read as it did a bar back: 30.7395 . Instead it repeats an incorrect number twice.
If someone would please look at my modification and help me out with this, I would really appreciate it.
Attached is the original i-Regr indicator and my broken mod.
Add Slope Calculation Directly In The Indicator As ExtMapBuffer For Your EA
I have tried that before, but I tried it again just to make sure. It produces this output (equivalent to un-shifted):
Hi mfurliend,
Earlier you posted you want to modify the "bar shift"..."index shift property"...
------------------
"I need to modify the indicator to let me to "bar shift" to any bar. For example, a "bar shift" of 1 should have 30.7395 as the last output instead of 30.2633.
Attempting to shift by incrementing the index shift property in the iCustom command does not do what I intend."
-------------
Your formula looks like you are subtracting Buffer[0] with the current bar (0) - past bar(1)...and then applying MathAbs.
The examples you provided:
Slope = MathAbs(1000000*( iCustom(Symbol(),0,"i-Regr",1,1,34,0,0,0)-iCustom(Symbol(),0,"i-Regr",1,1,34,0,0,1))/Period()));
Slope = MathAbs(1000000*( iCustom(Symbol(),0,"i-Regr",1,1,shift,0,0,0)-iCustom(Symbol(),0,"i-Regr",1,1,shift,0,0,1))/Period()));
I'm not sure if I understand exactly what you are trying to do...because both of these look like they are working fine to get your i-Regr values.
However...The "shift" value in that part of the formula looks like it applies to where the drawing will start and/or how far the lines go back...
As far as I can see, that "shift" value does not relate to getting the correct i-Regr values from current or past bars, unless I may be missing something?
You already have the current and past bar set in your formula and appear to be getting the right values...
Buffer0,0 = current bar
Buffer0,1 = past bar
...so you should be able to change the current/past bars to what you want (bar shift) to get past bar values?
I have not used this indicator before, so I am not sure if this will help, but I displayed the values directly in the indicator, and it seems to work ok.
One suggestion -
Try to add the Slope calculation as an additional ExtMapBuffer directly in the i-Regr indicator, then call the Slope calculations from this new buffer into your EA . That way you know you are getting the correct calculation you are looking for each time.
Hope this helps,
Robert
Waddah Double Indy
mtf_waddah_attar_explosionsa.mq4mn_amended_waddajalert.mq4Please can someone modify this to show the arrows at the change of state one arrow only.
I'm not sure if I understand exactly what you are trying to do...because both of these look like they are working fine to get your i-Regr values.
The problem is this: the indicator clears and re-draws its indicator buffer at each bar. If I have a 34 bar regression, then the past 34 index points are rewritten. Since it draws a straight line through the last 34 points, this means that (Pt0 - Pt1) = (Pt2 - Pt1) =(Pt3-Pt2)...etc
As far as I can see, that "shift" value does not relate to getting the correct i-Regr values from current or past bars, unless I may be missing something?
As far as the original i-Regr indicator goes, you are correct. I modified the indicator and changed the meaning of "shift" in the version that I posted.
You already have the current and past bar set in your formula and appear to be getting the right values...
Buffer0,0 = current bar
Buffer0,1 = past bar
...so you should be able to change the current/past bars to what you want (bar shift) to get past bar values?
No - because the indicator repaints itself to always draw a straight line through the last X price points.
Buffer0,0 = current bar
Buffer0,1 = past bar as calculated by the CURRENT BAR'S regression
One suggestion -
Try to add the Slope calculation as an additional ExtMapBuffer directly in the i-Regr indicator, then call the Slope calculations from this new buffer into your EA . That way you know you are getting the correct calculation you are looking for each time.
Jackpot! I knew that this was the solution but before I could not get it to work before. My mistake was that I was placing the underlined statement inside the loop; this caused the buffer to be re-written at each bar.
for(n=i0;n<=i0+p;n++)
{
sum=0;
for(kk=1;kk<=degree;kk++)
{
sum+=x[kk+1]*MathPow(n,kk);
}
fx[n]=x[1]+sum;
}
slope[0] = MathAbs(1000000*(fx[0]-fx[1])/Period());[/CODE]
output:
[CODE]2011.05.31 23:59 showslope EURUSD,M5: Slope: 30.2577
2011.05.31 23:55 showslope EURUSD,M5: Slope: 30.2577
2011.05.31 23:50 showslope EURUSD,M5: Slope: 29.7591
2011.05.31 23:45 showslope EURUSD,M5: Slope: 29.8319
This is the output I wanted except for 1 thing: why does the last value repeat like that?
P.S Thanks a ton for your time and assistance!!!
Mark at specified time
Please forgive poor English.
I made following indicator modified “Support_Resistance” indicator.
It's very simple, which draw marks where specified pips upper and below from open price of bar.
However, chart is full of marks, it is very complicated.
Please teach me to run this indicator at specified time.
ie.
At the place of red dot vertical line (each time are 8:15, 10;16, 14:15, 18:15) in attached chart,
though the chart atatched strange place.
//+------------------------------------------------------------------+
#property copyright ""
#property link ""
#property indicator_chart_window
#property indicator_buffers 4
#property indicator_color1 Blue//Red
#property indicator_color2 Magenta
#property indicator_color3 Blue
#property indicator_color4 Magenta//Green
extern int L_TP = 50;
extern int L_ST = 25;
extern int S_TP = 50;
extern int S_ST = 25;
//---- buffers
double v1[];
double v2[];
double v3[];
double v4[];
double val1;
double val2;
double val3;
double val4;
int i;
int init()
{
IndicatorBuffers(4);
//---- drawing settings
SetIndexArrow(0, 251);//119
SetIndexArrow(1, 251);
SetIndexArrow(2, 251);
SetIndexArrow(3, 251);
SetIndexStyle(0,DRAW_ARROW,STYLE_DOT,1,Red);
SetIndexDrawBegin(0,i);
SetIndexBuffer(0, v1);
SetIndexLabel(0,"L TP");
SetIndexStyle(1,DRAW_ARROW,STYLE_DOT,1,Magenta);
SetIndexDrawBegin(1,i);
SetIndexBuffer(1, v2);
SetIndexLabel(1,"L ST");
SetIndexStyle(2,DRAW_ARROW,STYLE_DOT,1,Blue);
SetIndexDrawBegin(2,i);
SetIndexBuffer(2, v3);
SetIndexLabel(2,"S TP");
SetIndexStyle(3,DRAW_ARROW,STYLE_DOT,1,Green);
SetIndexDrawBegin(3,i);
SetIndexBuffer(3, v4);
SetIndexLabel(3,"S ST");
return(0);
}
int start()
{
i=Bars;
while(i>=0)
{
val1 = L_TP;
v1=Open + val1/100;
val2 = L_ST;
v2=Open - val2/100;
val3 = S_TP;
v3=Open - val3/100;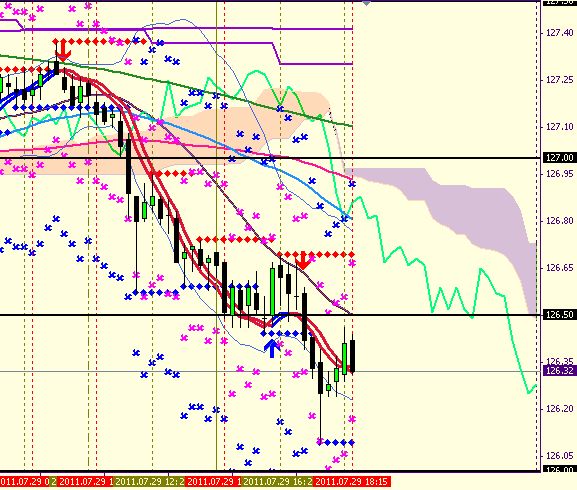
val4 = S_ST;
v4=Open + val4/100;
i--;
}
return(0);
}
//+------------------------------------------------------------------+
Last Bar Not Complete Yet Before Program Ends
Print("Slope: ",CurSlope);[/CODE]
output:
[CODE]2011.05.31 23:59 showslope EURUSD,M5: Slope: 30.2577
2011.05.31 23:55 showslope EURUSD,M5: Slope: 30.2577
2011.05.31 23:50 showslope EURUSD,M5: Slope: 29.7591
2011.05.31 23:45 showslope EURUSD,M5: Slope: 29.8319
This is the output I wanted except for 1 thing: why does the last value repeat like that?
P.S Thanks a ton for your time and assistance!!!Hi Mfurlend,
Glad you found a way to place the calculation in the indicator...
Regarding your "last repeat value"... I am curiously clueless...so this is just a guess for you to check out.
I noticed that your time is M5....but your last printout is only 4 minutes...
It may be that the current bar did not complete before the program ended, so it's still showing the last value in the buffer...so it repeats?
Hope this helps,
Robert
WahhahAttr Indy
mtf_waddah_attar_explosionsa.mq4mn_amended_waddajalert.mq4Can someone fix this to only alarm once and show the arrow at the change of state. Right now it will only alarm and show the arrow once the opposite conditions shows.
This is what it is doing now.
I would like it to show the arrow and alarm at the red circle I drew also.
Market Range Alert
I made an Indicator if market reach 100% Average Range it will alert me, but I have minor coding experience and the alert keep posting me every tick, can anyone expert help me to fix This? Please Find The Indicator on attachment.
Thanks.
dpc_market_range_alert.mq4