Didgeridoo Trading System
Timeframes
4 hour charts and 15 minute charts
Buy Trades
Buy Trades
1. Load the indicators onto the 4 hour chart. If price is below the center regression (purple) line, then we are going to look for long (buy) trades only.
2. There are two entry rules, both from the 15 minute chart:
Rule A: If price crosses above the center regression (purple) line from below, then we buy two lots.
Rule B: If the CCI crosses above 0 from below AND the RSI crosses above 40 from below, then we buy two lots.
3. Stop loss is placed 30 pips below the entry price.
4. Exit the first lot after a gain of 30 pips. Move stop loss to breakeven after 30 pips have been gained and trail the stop on the second lot to maximize profit.
Buy Example
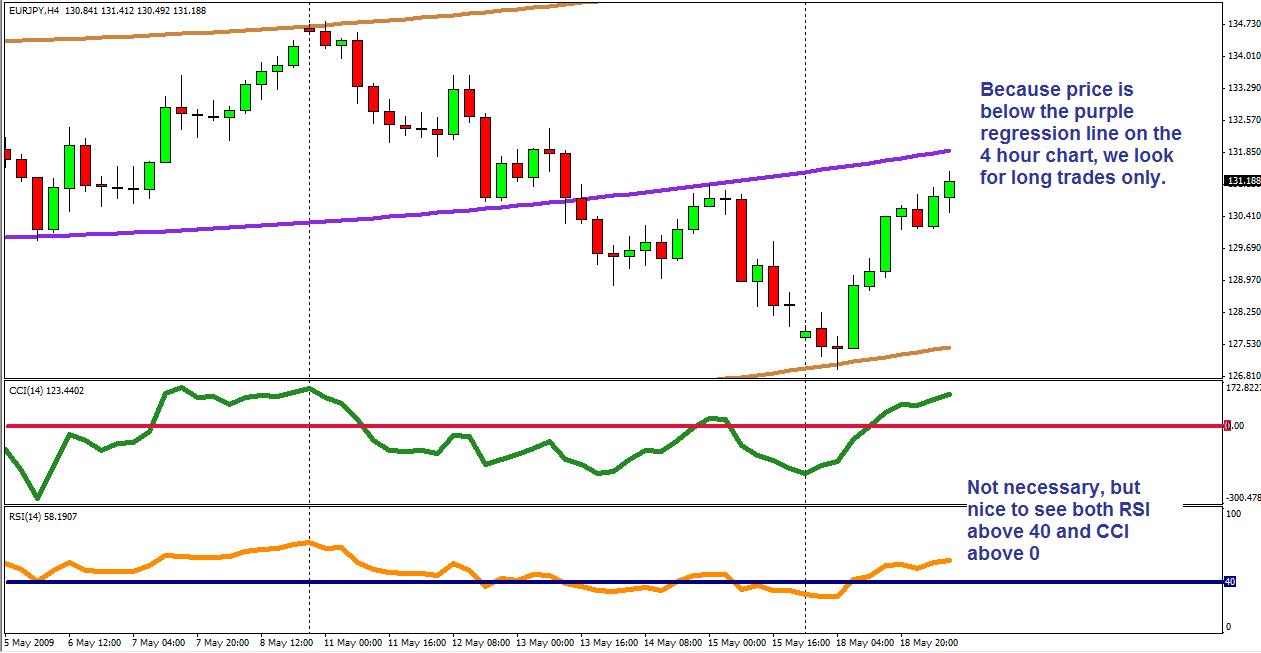
EUR/JPY 4 hour chart
Price is trading below the regression (purple) line, so we are looking to go long.
Ideally, we would see both the CCI above the 0 line and the RSI above the 40 line, but this is not necessary.
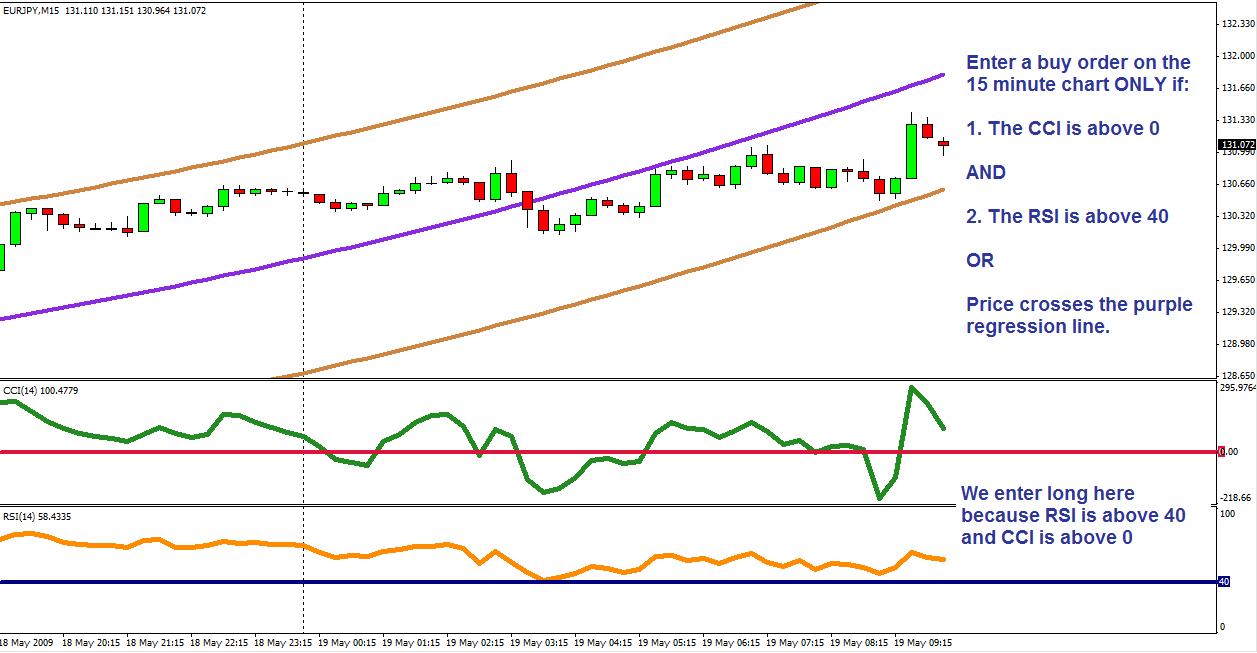
15 min chart - Entry Rules
We enter if one of two things happens on the 15 min chart:
RULE A:
Price crosses above the regression (purple) line
OR
RULE B:
Both the CCI crosses above the 0 line AND the crosses RSI above the 40 line.
In this case we enter a long trade because the conditions of Rule B are met.
Position Size:
We buy two lots.
Stop loss is placed 30 pips below the entry price.
Exits:
We exit 1 position at 30 pips profit and we move the stoploss to breakeven for the other position and let the trailing stop get stopped out. For every move 5 pips up I move the stoploss 5 pips up.
Sell Trade Rules
Sell Trades
1. Load the indicators onto the 4 hour chart. If price is above the center regression (purple) line, then we are going to look for short (sell) trades only.
2. There are two entry rules, both from the 15 minute chart:
Rule A: If price crosses below the center regression (purple) line from above, then we sell two lots.
Rule B: If the CCI crosses below 0 from above AND the RSI crosses below 40 from above, then we sell two lots.
3. Stop loss is placed 30 pips above the entry price.
4. Exit the first lot after a gain of 30 pips. Move stop loss to breakeven after 30 pips have been gained and trail the stop on the second lot to maximize profit.
thnx for sharing,
on your post 9, dont you mean : CCI BELOW the 0 line
you wrote above....
on your post 10, you say :
RULE B:
Both the CCI crosses below the 0 line AND the RSI crosses ABOVE the 40 line.
But
on the chart you say RSI BELOW the 40 line
please clarify.
And also, at crossings, do you wait for candle to close before entering a trade ?
Sell Trade Example
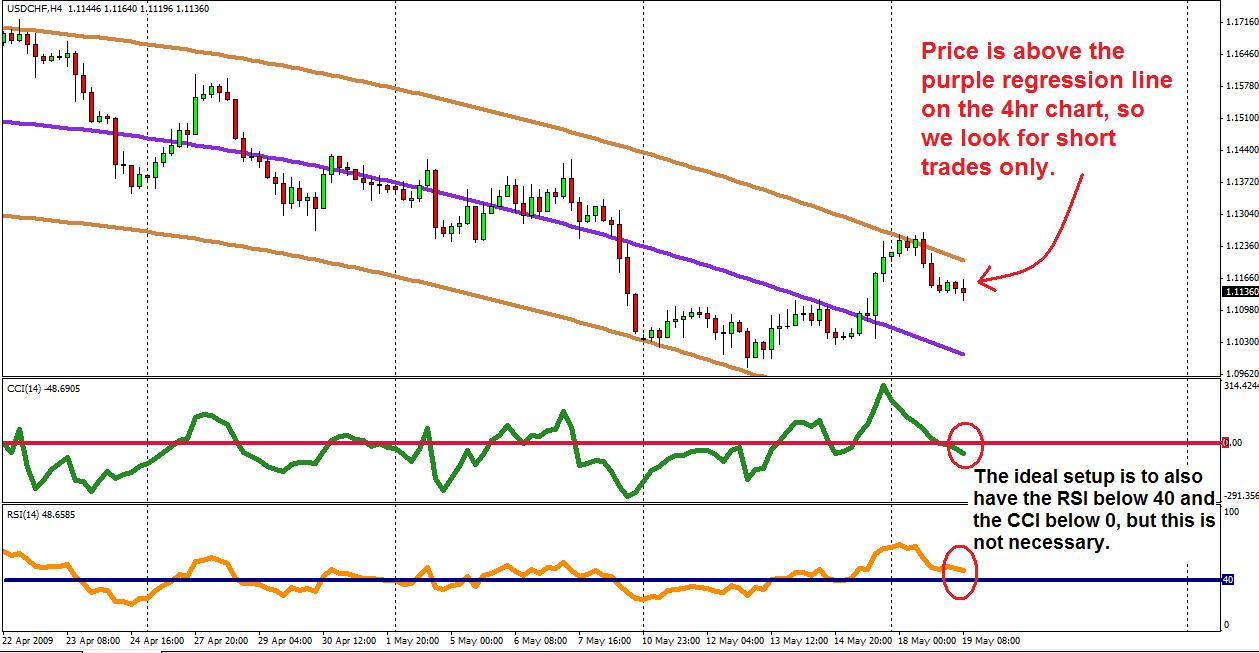
Take a look at the 4hr chart
Price is trading above the regression (purple) line, so we are looking to go short.
Ideally, we would see both the CCI below the 0 line and the RSI below the 40 line, but this is not necessary.
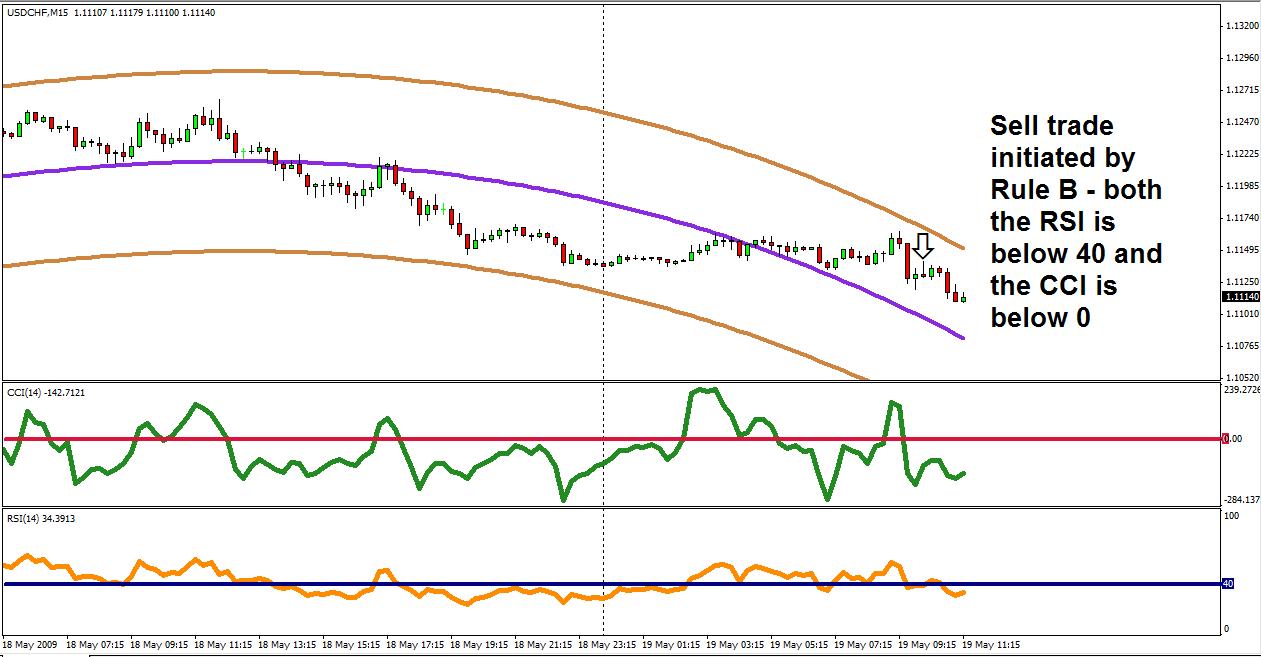
15 min chart - entry signal
We enter if one of two things happens:
RULE A:
Price crosses below the regression (purple) line.
OR
RULE B:
Both the CCI crosses below the 0 line AND the RSI crosses below the 40 line.
In this case we enter a short trade because the conditions of Rule B are met.
Position Size:
We sell two lots.
Stop loss is placed 30 pips above the entry price.
Exits:
We exit 1 position at 30 pips profit and we move the stoploss to breakeven for the other position and let the trailing stop get stopped out. For every move 5 pips down I move the stoploss 5 pips down.
- Free trading apps
- Over 8,000 signals for copying
- Economic news for exploring financial markets
You agree to website policy and terms of use
This is a discretionary system that works really well for me.
Was wondering if anyone might want to take a stab at an EA for this one.