Indicator for extremes near open
While not exactly what you are looking for, there is an indicator called the 'Directional Day Filter' which is quite useful for determining the trend for the day based on the first hour.
I could provide two different versions coded in C# (NinjaScript) and here is the EasyLanguage code if it helps:
Inputs: PlotTime(5),Delay(60) ;
Vars: NuHi(c), NuLo(c), Med(0);
If dd[1] then begin
NuHi = H;
NuLo = L;
end;
If H>NuHi then NuHi = H;
If L<NuLo then NuLo = L;
If T = CalcTime(Sess1StartTime,PlotTime) then Med = (NuHi+NuLo)/2;
If Med > 0 then plot1(Med,"DDFLine");
If t = CalcTime(Sess1StartTime,Delay) and nulo>0 then begin
Plot2(NuHi,"hi");
Plot3(NuLo,"lo");
Plot4(C,"C");
If checkalert then alert = true;
end;While not exactly what you are looking for, there is an indicator called the 'Directional Day Filter' which is quite useful for determining the trend for the day based on the first hour. I could provide two different versions coded in C# (NinjaScript) and here is the EasyLanguage code if it helps:
Thank you...this looks interesting...Is this indicator available for MT4?
I am not a programmer(very computer illiterate!) 
i use this to guage my uk open trades for direction
it colors the high/low of the asian session
pretty good really
loooking for a way of getting the US open
im thinking
its either a continuance of the uk session or reversal
just a fresh idea
Originally Posted by Perky
i use this to guage my uk open trades for direction
it colors the high/low of the asian session
pretty good really
Thank you for sharing your $TrillionDollarDaysHML indicator Sir,
May I ask question ?
The using of this indi, is it the same with Session indicator Sir ?
BestRegards,
ServerUang
no the session indi just tells you when the sessions begin and start - from what I understand
this indicator shows the high and low from the asian session
and you can judge your trades from there
for thr uk session
Thank you Sir for the answer, I will try and learn more about your indi.
ServerUang
Hi Perky
Could you post the template file and the relevant indicators for the initial picture posted?
Thanks
Wayne
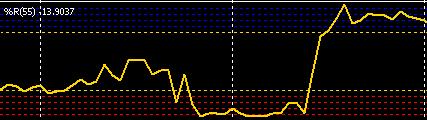
Hello, what is this indicator your using;
Can you post it please
ThanksI believe it's just Williams % R...set at 55....it comes standard with Metatrader.
Best,
cl
- Free trading apps
- Over 8,000 signals for copying
- Economic news for exploring financial markets
You agree to website policy and terms of use
I am looking for an indicator that will plot the (open - low)if the low is closest to the open....and the (high-open) if the high is closest to the open.
I would also like to be able to plot a 10 period average of each of these..example: a 10 SMA of open -low...only open minus the low when the open is closest to the low...vice versa for the high - open.
Also is there a way I can plot the weekly open on smaller timeframe charts?
Thank you!