Monster ES Day Trading System Rules
I wanted to share a system I have been using for the past few days with some great results. I welcome any comments/feedback you can provide to improve the rules.
Here is the setup for Tradestation:
1) Create a 3000 tick bar chart of the @ES.D. The system also works on the @ER2.D.
2) Insert a 9 period EMA moving average. Make this line white.
3) Insert a 55 period SMA moving average. Make this line magenta.
4) Insert the Tradestation built-in indicator "TrendLines Automatic". Use the following settings: TrendLines Automatic(4,4,10,"Yes","Red","Blue","Intrabar").
5) Insert the MACD indicator. Use the default settings: 12,26,9.
Here are the trading rules:
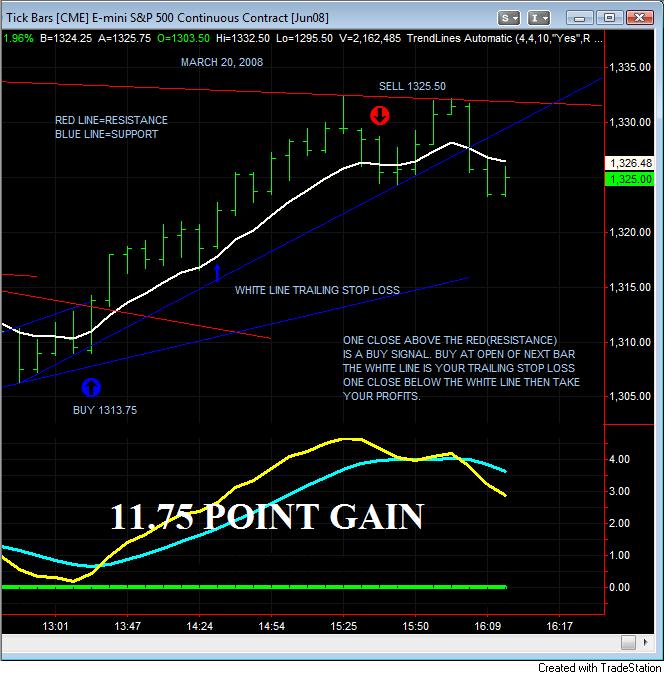
1. Red line-this is the resistance line. This line will only be used for buy signals. One close above the red line and you can take a long(buy) entry on the open of the next bar.
2.Blue line-this is the support line. This line will only be used for sell signals. One close below the blue line and you can take a short(sell) entry on the open of the next bar.
3. White line-this line is your intial stop line and trailing stop line. Once you close above the red line or below the blue line then you use the white line as your stop. For ex: if you close one bar outside of the red line would be a buy signal at the open of the next bar. After entry your intial stop and trailing stop would be one close below the white line after entry.
4.Yellow/cyan line-these two lines are at the bottom of the chart. If the yellow line is above the cyan line the market is in an uptrend. If the yellow is below the cyan then the market is in a downtrend. The wider the lines are apart from each other then the stronger the trend in that direction. Also, you will notice a green horizontal line just near these lines. If both lines are above this green line(also called zero line) then the market is in a strong uptrend. If both lines are below the green horizontal line then the market is in a strong downtrend. In uptrends you like to see the yellow above the cyan and both lines above the green(zero line). This indicator validates the breakouts and breakdowns when you enter the market.
Here is a screen shot from March 20th, 2008:
Hope this helps my fellow traders.
Feedback and comments are welcome.Hi Jaywireman -
This is just like DeMark's TD Lines, except you have a few exponentially calculated filters added for entry. From experience, TD Lines and Price Breakout Qualifiers work much better in the futures and equity markets, and not as much in forex. The FX market can be a "runny" market, due to its structure, with looser bars giving falser signals for some strategies based on pure price action. Also, tick charts provide a much better representation, in my opinion, than charts using static timeframes. You are more than right to use added filters for the strategy. Even DeMark recommends using several other indicators in many of his systems, icluding TD Lines. If you search for it, you'll find the extra material somewhere on this forum. It might be of help to you. There are three Price Breakout Qualifiers, and an open above the trendilne is one of them. There's a few indicators for MQ4 with this strategy built in, but as a standalone, gives mixed results.
- Free trading apps
- Over 8,000 signals for copying
- Economic news for exploring financial markets
You agree to website policy and terms of use
I wanted to share a system I have been using for the past few days with some great results. I welcome any comments/feedback you can provide to improve the rules.
Here is the setup for Tradestation:
1) Create a 3000 tick bar chart of the @ES.D. The system also works on the @ER2.D.
2) Insert a 9 period EMA moving average. Make this line white.
3) Insert a 55 period SMA moving average. Make this line magenta.
4) Insert the Tradestation built-in indicator "TrendLines Automatic". Use the following settings: TrendLines Automatic(4,4,10,"Yes","Red","Blue","Intrabar").
5) Insert the MACD indicator. Use the default settings: 12,26,9.
Here are the trading rules:
1. Red line-this is the resistance line. This line will only be used for buy signals. One close above the red line and you can take a long(buy) entry on the open of the next bar.
2.Blue line-this is the support line. This line will only be used for sell signals. One close below the blue line and you can take a short(sell) entry on the open of the next bar.
3. White line-this line is your intial stop line and trailing stop line. Once you close above the red line or below the blue line then you use the white line as your stop. For ex: if you close one bar outside of the red line would be a buy signal at the open of the next bar. After entry your intial stop and trailing stop would be one close below the white line after entry.
4.Yellow/cyan line-these two lines are at the bottom of the chart. If the yellow line is above the cyan line the market is in an uptrend. If the yellow is below the cyan then the market is in a downtrend. The wider the lines are apart from each other then the stronger the trend in that direction. Also, you will notice a green horizontal line just near these lines. If both lines are above this green line(also called zero line) then the market is in a strong uptrend. If both lines are below the green horizontal line then the market is in a strong downtrend. In uptrends you like to see the yellow above the cyan and both lines above the green(zero line). This indicator validates the breakouts and breakdowns when you enter the market.
Here is a screen shot from March 20th, 2008:
Hope this helps my fellow traders.
Feedback and comments are welcome.