Hello everybody,
I'm newbies. Can anybody help me to build this indicator?
This indicator shows:
(a) Open daily price line
(b) 50 pips line above Open daily price line
(c) 100 pips line above Open daily price line
(d) 50 pips line below Open daily price line
(e) 100 pips line below Open daily price line.
All these lines are different colours.
Thanks for everybody.
anyway, scalping is nitemare, the simple way to get more than 1000pips is longterm trading style. just follow up the big trend.
Dolly
Hello everybody,
I'm newbies. Can anybody help me to build this indicator?
This indicator shows:
(a) Open daily price line
(b) 50 pips line above Open daily price line
(c) 100 pips line above Open daily price line
(d) 50 pips line below Open daily price line
(e) 100 pips line below Open daily price line.
All these lines are different colours.
Thanks for everybody.
Hi
If you use the Dolly indicator and reset the levels to suit your style, Dolly set to the Daily Open has levels at 20/40/50 above/below the Open and there is also a line only version on the 2nd clone Dolly thread as well towards the very end of the thread.
cja
Thank you guys.
I already made 50 pips by using this technique today.
I know the dolly, but how to change 20/40/50? Can anybody help me?
I very appreciate that. 
Line indicator
Thank you guys.
I already made 50 pips by using this technique today.
I know the dolly, but how to change 20/40/50? Can anybody help me?
I very appreciate that.
Here you are i just modified the Dolly Lines to your requirements
I suggest you look under the inputs tab on the indicator, there you will find all the settings for line settings 50/100 etc colors/widths/type of line etc.
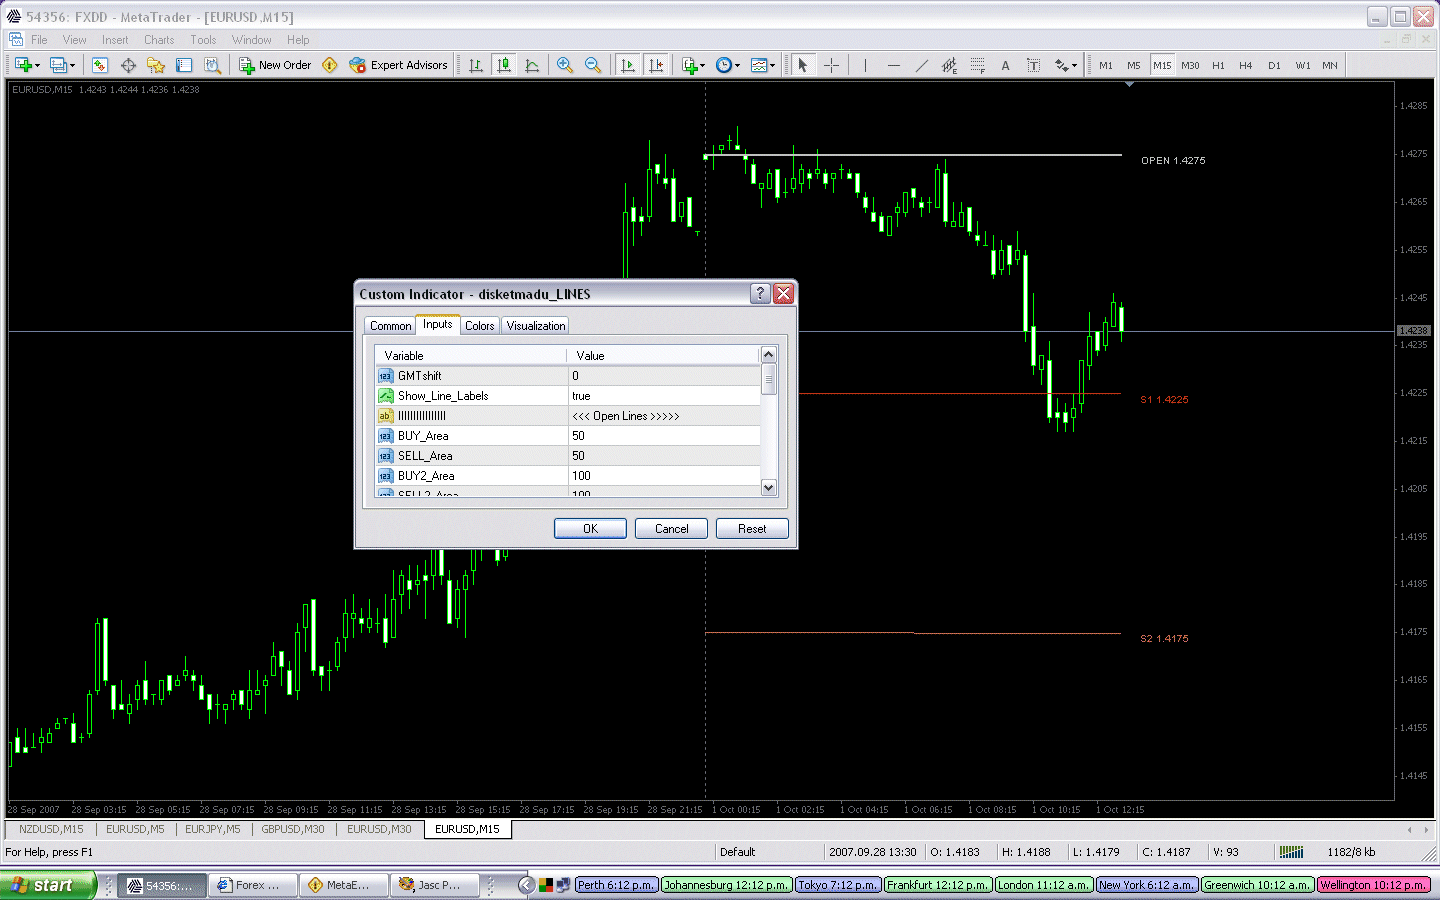
To find the inputs load the indicator onto a chart-right click the mouse onan empty part of the chart and select indicator list- then highlight the indicatoryou want to alter disketmadu_LINESin this example by left clicking on the indicator name in the list - then select editfrom the boxes on the right side of the popup window - then select inputs from the tab on the upper left of the box - and alter the settings as required.
the inputs box will look like this

Thanks so much cja.
I like your indicator. For your information, i already backtested gbpjpy by using this technique from Jan 2 until the end of sept 2007, there is 79% profitable. You can check that. I guarantee you.
This technique is very good and suitable for me. 
Which rules did you use for testing the ssytem? Entries...SL...TP....
Thanks
emeric
Thanks so much cja.
I like your indicator. For your information, i already backtested gbpjpy by using this technique from Jan 2 until the end of sept 2007, there is 79% profitable. You can check that. I guarantee you.
This technique is very good and suitable for me.
Which rules did you use for testing the ssytem? Entries...SL...TP....
Thanks
emericThe system is like this :
Buy stop buy and sell stop 50 pips from daily open market. Target 50 pips and stop loss 100 pips. You must open your position at 5 a.m. ( GMT +8 ) when new day is open. Just use hourly chart. This trading system is most suitable with gbpjpy only. Other pairs i don't recommend it. 
Thanks, cja. I plotted your new modified indicator per disketmadu on my ER2 trade today. Very nice and seems to work well with my PAD. You can see it on on the last chart I posted in my thread. cja, Excellent piece work as usual.
disketmadu, you have a good method though we differ a bit on our trade approach. CONGRATULATIONS! Continue on with the good work and keep us posted.
ENJOY!
fxcruiser
The system is like this : Buy stop buy and sell stop 50 pips from daily open market. Target 50 pips and stop loss 100 pips. You must open your position at 5 a.m. ( GMT +8 ) when new day is open. Just use hourly chart. This trading system is most suitable with gbpjpy only. Other pairs i don't recommend it.

What happens if the 50PIP is not hit, do you close the position before the next day session?
I have a question cja, if you can help me please.
How can i make the disketmadu_LINES go under the price bar and not over it as shown in this picture.

- Free trading apps
- Over 8,000 signals for copying
- Economic news for exploring financial markets
You agree to website policy and terms of use
Hello everybody,
I'm newbies. Can anybody help me to build this indicator?
This indicator shows:
(a) Open daily price line
(b) 50 pips line above Open daily price line
(c) 100 pips line above Open daily price line
(d) 50 pips line below Open daily price line
(e) 100 pips line below Open daily price line.
All these lines are different colours.
Thanks for everybody.