Doe anyone know if there is an indicator for this.
Thanks.
Doe anyone know if there is an indicator for this. Thanks.
Well, this is probably not exact thing that you are looking for , but it draws lines with specific periods so here, check this out.
Or just use this indicator https://www.mql5.com/en/forum/general for many vertical lines drawing.
You may do it using MetaTrader.
Click on "Vertical Line" (see image), draw the line on the chart, then double left mouse click on the line, then right mouse click on the line and:
- select time;
- color and property of the line;
- or move the line in any place;
- or delete the line (pressing "Delete" in keyboard).
thanks guys!
Or just use this indicator https://www.mql5.com/en/forum/general for many vertical lines drawing.
Is drawing a veritcal or horizontal line from an expert (EA) different from drawing them from an indicator?
Can you please show a sample code to draw both vertical and horizontal lines from an expert advisor?
Thanks a lot.
fxd01
Is drawing a veritcal or horizontal line from an expert (EA) different from drawing them from an indicator?
Can you please show a sample code to draw both vertical and horizontal lines from an expert advisor?
Thanks a lot.
fxd01It is indicator drawing horizontal lines at exact time every day. You may set how many lines you want to be on the chart and time for every line. And color.
You may download indicator from the link and see inside the code.
How to create a rectangle diagonal object?
Hi All,
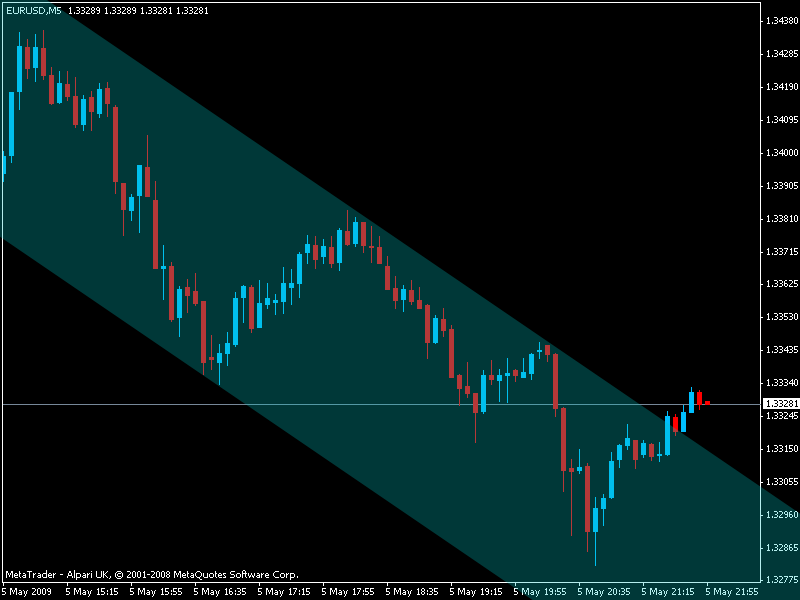
Is anybody here could tell me how to make a rectangle diagonal object like the picture below?

Basically I want to draw a trendline, mark x pips above the trendline as the upper limit and mark y pips below the trendline as the lower limit, then colouring the zone along the trendline.
Any help is very appreciated. I haven't try all of the object's function though, but I'm curious if anybody here could do that because I've never seen any of this coded before (perhaps I need to surf more in the net, LOL).
Well, thank you.
Dear Mr Moderator,
Is it correct to move my thread here? because my request is not sounds like a "vertical line" at all. It's more a rectangle object. But if you think it is, then no problem. 
note : this is not for an indicator, it's for an EA with an ability to show the trading zone.
Thanks
I know that it is different. I moved just to keep similar cases in one place. Because this thread was linked many times and quoted many times everywhere. So, it is better to be in well promoted thread anyway. Forum is big.
------
May be you can try channel indicator?
https://www.mql5.com/en/forum/173261
https://www.mql5.com/en/forum/172920
There are some channels here as well https://www.mql5.com/en/forum/172904
If you are asking about how to program so I am sorry - I am not a coder.
- Free trading apps
- Over 8,000 signals for copying
- Economic news for exploring financial markets
You agree to website policy and terms of use
Is there an indicator out there that will add 2 vertical lines on a chart at specific times that are giving. The times are not important, but just need it to draw 2 vertical lines on the chart.
I would like to be able to change the following in the properties area:
1. time for line one
2. time for line two
3. colors for the lines
4. draw lines during the last week .....TRUE
5. draw the lines back through history...FALSE
It would be nice to have them draw back in the past not just currently, if that is possible.