Elite indicators :) - page 1499
You are missing trading opportunities:
- Free trading apps
- Over 8,000 signals for copying
- Economic news for exploring financial markets
Registration
Log in
You agree to website policy and terms of use
If you do not have an account, please register
Thanks to Mladen and Sergey for the help!
Hi Mlanden,
its possible to make your indicator to MT4 platform, im talk about this indicator
https://www.mql5.com/en/code/16826
i hope you will help, thanks in advance.
dear Mladen Rakic;
You could have added warning signs.
Thanks for your help
.
A kind of a test, but the results are a bit surprising
This is a Spearman rank correlation of rsi (the usual set of 6 types of rsi).
----
On attached picture: Regular Spearman (blue) Spearman of RSX (light blue). The difference in showing the trend phase. Interesting.
dear,mladen
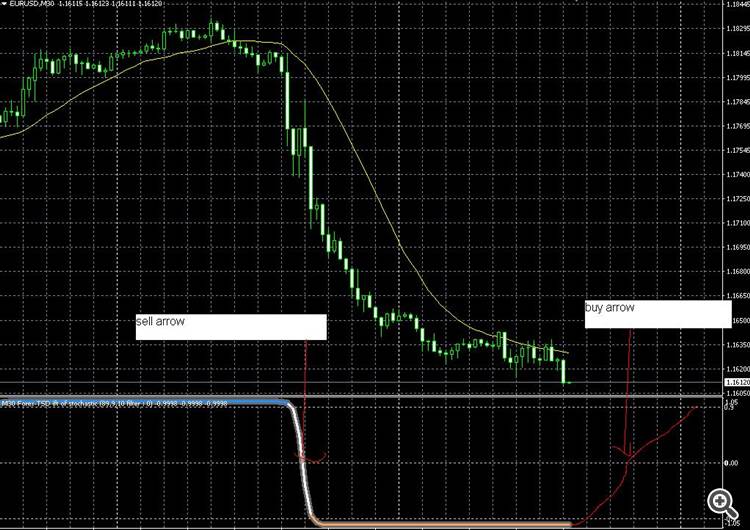
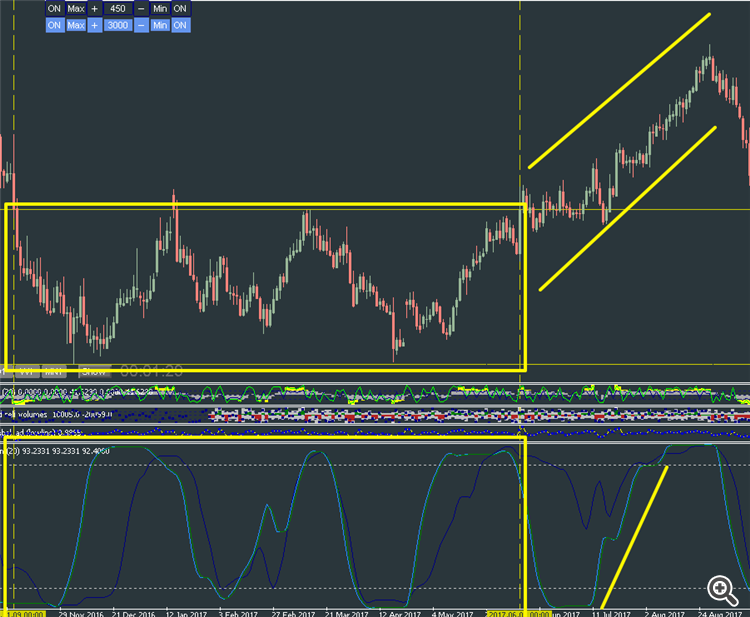
pls discribe indicators use in this image, i am searching this indicators
Dears MLaden, Mrtools and all other coders ,
I can finally write the conditions for a crossover between BBands_Stop an EMA ?
if((slowerEMAnow <= curr_UpTrendLine) && (slowerEMAprev > prev_UpTrendLine))
if((slowerEMAnow >= curr_DownTrendLine ) && (slowerEMAprev < prev_DownTrendLine))
And I am lokking for any indicator that draw resistance and support lines Using the Kumo (or Ichimoku Cloud) on chart ? I want use it for breakouts.
Does someone have this indicator ? Thanks for sharing
Thank you
ok I didn't know there is a newer version.
I want to hire you for the Ichimoku R/S indicator
Hello,
Congratulations on your work here.
The attached indicator on this forum on page 36 has stopped working.
Can anyone help with updating it?
Thank you in advance for your attention.
could someone fix "composite tsi mtf & alerts.ex4" ? because when using the MTF in backtest, it doesn't work, i can't retrieve the data.
thanks