Need an Indicator That Isolates SIDEWAYS Market. - page 2
You are missing trading opportunities:
- Free trading apps
- Over 8,000 signals for copying
- Economic news for exploring financial markets
Registration
Log in
You agree to website policy and terms of use
If you do not have an account, please register
It is the indicators from previous post.
your problem is as old as the stock markets started...if you can find an indicator that tells you the difference between a ranging and a trend market (wich is not lagging or AFTER the facts) you will become a billionare....
regards...iGoR
your problem is as old as the stock markets started...if you can find an indicator that tells you the difference between a ranging and a trend market (wich is not lagging or AFTER the facts) you will become a billionare.... regards...iGoR
Agree, but as sideway market is about 70% of the time,at least we can filter it more.
Possible or not possible?
Hello Friends,
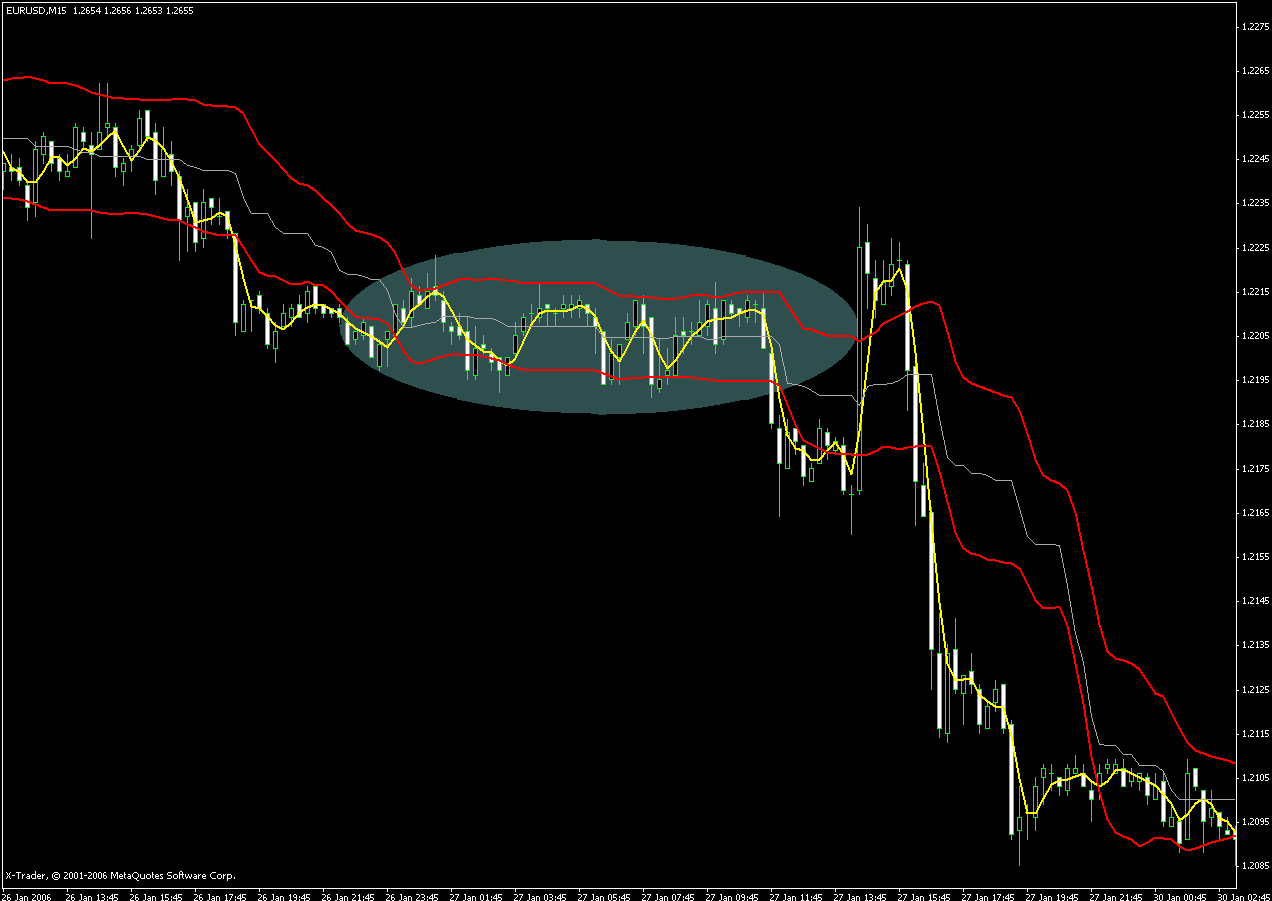
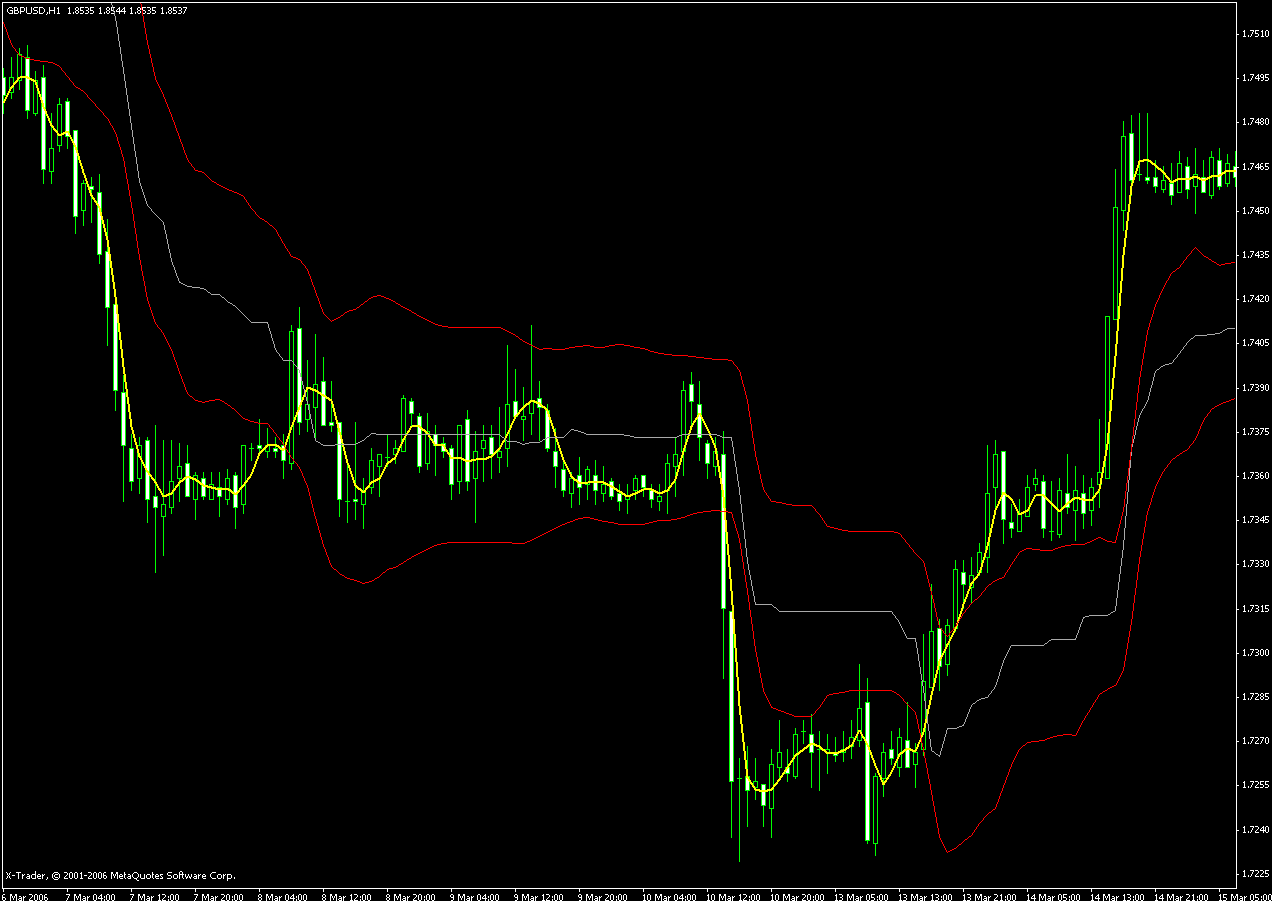
I have been trying hard to find a simple indicator that clearly and Reliably isolates the Sideways market - Please see the attached chart - I need to Identify the region inside the eclipse...
Humble TraderHi...
I wanted to figure it out, but there is no good sollution of this problem.
Before You take a look on pictures I placed below, You must remember:
"I show You that, what You want to see".
This indicator looks nice but works only sometimes - it means it does not work at all...
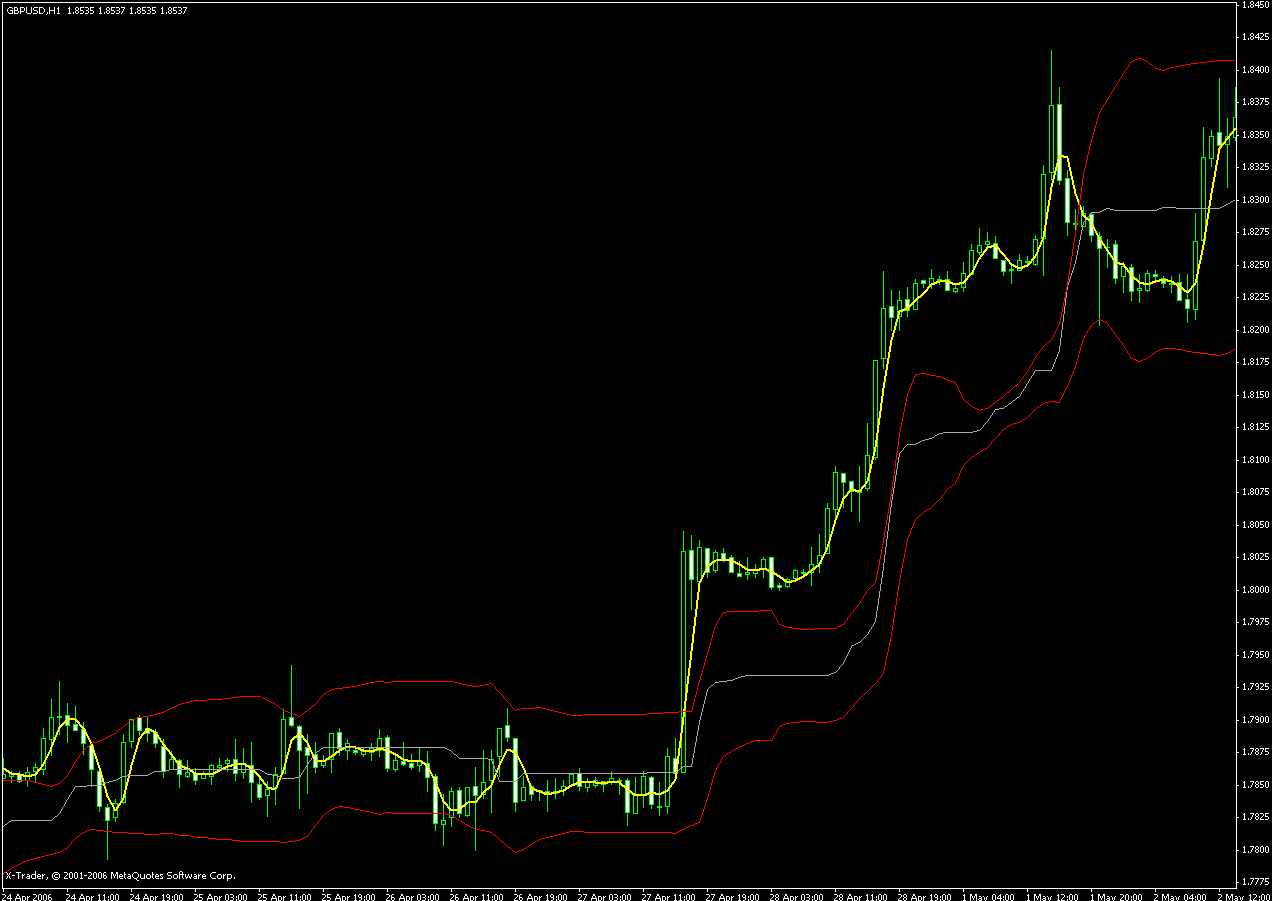
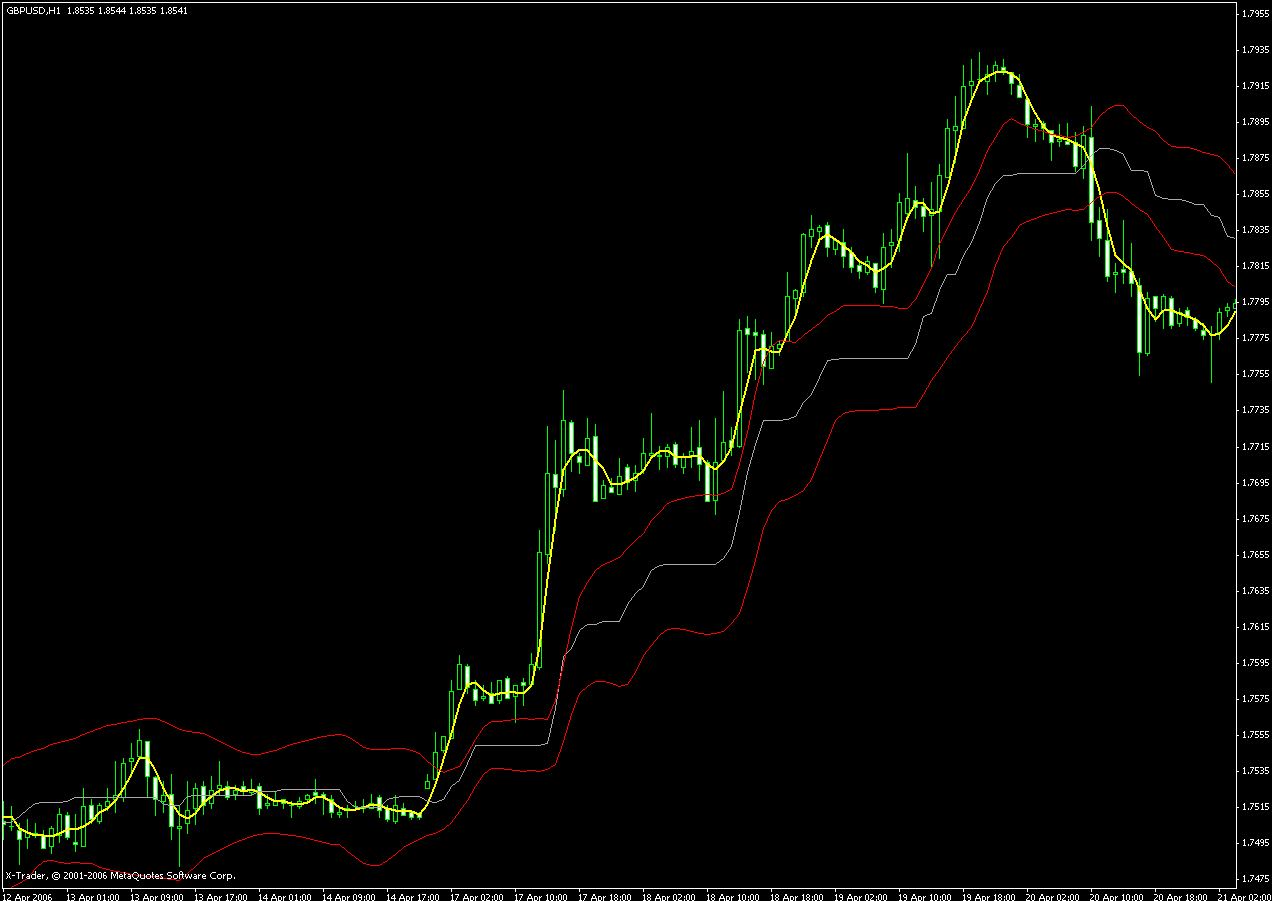
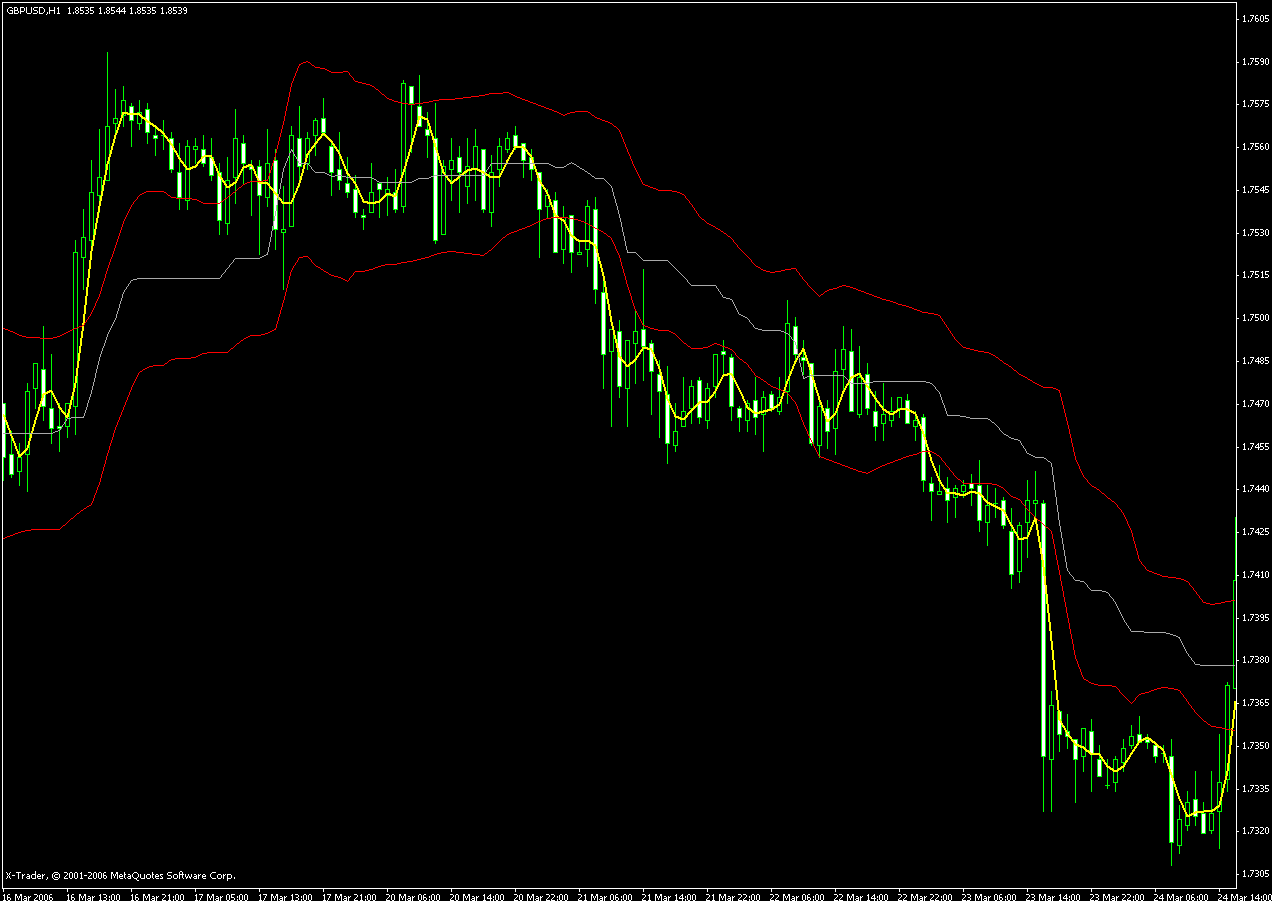
Basic rule: if yellow MA is between red lines - it is "the Sideways market",
if trend is strong - MA stays under/over red lines.
Raff
Hi...
I wanted to figure it out, but there is no good sollution of this problem.
Before You take a look on pictures I placed below, You must remember:
"I show You that, what You want to see".
This indicator looks nice but works only sometimes - it means it does not work at all...
Basic rule: if yellow MA is between red lines - it is "the Sideways market",
if trend is strong - MA stays under/over red lines.
Raffhi, can you post this indicator?
Thanks
hi, can you post this indicator? Thanks
Monday morning I will clear code and send it as You wish...
Then You will know why it does not work ;-)
Raff
try smma(16) and an envelopes of smma(16) + set the deviation to fit each pair
work best in H1 scale
Maybe..
Monday morning I will clear code and send it as You wish...
Then You will know why it does not work ;-)
RaffDid you use trend band with round pip indicator..?
it looks like trend band to me
Bollinger Bands:
Were designed specifically for this issue.
1 - Test for M15 Range < 10
2 - Relax
3 - Enjoy the show!
Check Friday's charts for verification
Regards