GC Oscillator
It's a great example!
https://www.mql5.com/en/forum/173756
I think this oscillator (documented in Ehlers section), is a very good exercise for this section.
In fact I think we could develop as much indicators from Ehlers as possible.
Figure 1. Easy Language Code to Compute the CG Oscillator
Inputs: Price((H+L)/2),
Length(10);
Vars: count(0),
Num(0),
Denom(0),
CG(0);
Num = 0;
Denom = 0;
For count = 0 to Length - 1 begin
Num = Num + (1 + count)*(Price[count]);
Denom = Denom + (Price[count]);
End;
If Denom 0 then CG = -Num/Denom;
Plot1(CG, "CG");
Plot2(CG[1], "CG1");
Forexts,
Thank you very much for your suggestion; it's really a very good exercise.
It will be our next lesson.
At the same time the Oscillator's name starts with my name's first letters CG (Center of Gravity) (Coders' Guru):D
Cog
I do not yet have access to the Elite section, anyone care to critique my COG indicator for MQL4?
//| Ehlers COG.mq4 |
//+------------------------------------------------------------------+
#property indicator_separate_window
#property indicator_buffers 2
#property indicator_color1 Red
#property indicator_color2 Blue
extern int COGPeriod = 10;
double COG[], COG1[], wrkArray[];
//+------------------------------------------------------------------+
int init()
{
IndicatorBuffers(2);
IndicatorDigits( MarketInfo( Symbol(), MODE_DIGITS ));
SetIndexStyle(0, DRAW_LINE);
SetIndexStyle(1, DRAW_LINE);
if( !SetIndexBuffer( 0, COG ) &&
!SetIndexBuffer( 1, COG1 ))
Print( "cannot set indicator buffers!" );
SetIndexDrawBegin( 0, COGPeriod );
SetIndexDrawBegin( 1, COGPeriod );
IndicatorShortName( "Ehlers COG" );
return(0);
}
//+------------------------------------------------------------------+
// Calculating Ehlers Center of Gravity
//+------------------------------------------------------------------+
// COG = -1 * (NUM / DENOM)
// NUM = the sum of [PRICE * (i + 1)] from 0 to N
// DENOM = the sum of PRICE from 0 to N
// where N equals the number of periods (COGPeriod)
// PRICE[0] equals the current bar
// PRICE[1] equals the previous bar
// PRICE[n] equals the price from n bars previous
//+------------------------------------------------------------------+
int start()
{
int i, j, limit, iWrk00;
int countedBars = IndicatorCounted();
double dWrk00, num, denom;
limit = Bars - countedBars;
for( i = 0; i < limit; i++ )
{
if((i >= COGPeriod) || (limit < 10))
{
num = 0;
denom = 0;
for( j = 0; j < COGPeriod; j++)
{
if(limit < 10)
iWrk00 = i + j;
else
iWrk00 = i - COGPeriod + j;
dWrk00 = (High + Low) / 2;
num = num + (1 + j) * dWrk00;
denom = denom + dWrk00;
}
if(limit < 10)
iWrk00 = i;
else
iWrk00 = i - COGPeriod;
COG = -num / denom;
if(iWrk00 > 0)
COG1 = COG;
}
}
return(0);
}
//+------------------------------------------------------------------+It doesn't seem to be charting out for me 
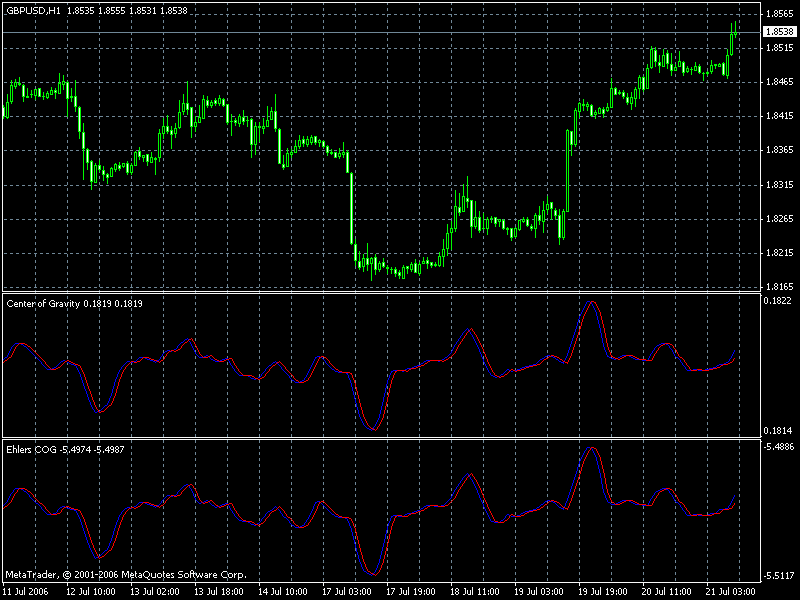
Yes, they do look nearly identical.
And I am able to get the display now. I must have placed an invalid character somewhere while viewing in the editor.
Thanks NewDigital!
- Free trading apps
- Over 8,000 signals for copying
- Economic news for exploring financial markets
You agree to website policy and terms of use
https://www.forex-tsd.com/forum/debates-discussions/1314-event-driven-programming
I think this oscillator (documented in Ehlers section), is a very good exercise for this section.
In fact I think we could develop as much indicators from Ehlers as possible.
Figure 1. Easy Language Code to Compute the CG Oscillator
Inputs: Price((H+L)/2),
Length(10);
Vars: count(0),
Num(0),
Denom(0),
CG(0);
Num = 0;
Denom = 0;
For count = 0 to Length - 1 begin
Num = Num + (1 + count)*(Price[count]);
Denom = Denom + (Price[count]);
End;
If Denom 0 then CG = -Num/Denom;
Plot1(CG, "CG");
Plot2(CG[1], "CG1");