Forum on trading, automated trading systems and testing trading strategies
Sergey Golubev, 2016.12.28 06:09
USD/JPY Intra-Day Technical Analysis - ranging on reversal (based on the article)
H1 price is located near and above SMA with period 200 (200 SMA) for the bouncing from 200 SMA value back to the primary bearish area of the chart. Bearish development retracement pattern is forming by the price for the bearish reversal to be started with 23.6% Fibo level at 117.53 to be crossed to below with 117.36 level as the nearest target to re-enter.
"The Japanese Yen has halted its decline against the USD as 2016 comes to a close. However, since September 21, when the Bank of Japan announced the significance Yield Curve Control policy or YCC, USD/JPY has now risen by as much as ~19.35% and could continue higher into 2017 given a recent message from Japan’s Chief Cabinet Secretary Yoshihide Suga in a Nikkei News Interview. The interview from Shinzo Abe’s ‘right-hand’ turned focus on the FX market as one the most critical crisis managements for his post as Chief Cabinet Secretaryis the FX market. Specifically, his focus was on creating a stable financial and economic environment for Japanese corporations so they could borrow and grow within a stable environment."
- If the price breaks 117.73 resistance level so the bullish trend will be resumed.
- If price breaks 23.6% Fibo level at 117.53 so the bearish reversal will be started.
- If not so the price will be ranging within the levels.
| Resistance | Support |
|---|---|
| 117.73 | 117.53 |
| N/A | 117.36 |

- Recommendation to go short: watch the price to break 117.53 support level for possible sell trade
- Recommendation to go long: watch the price to break 117.73 resistance level for possible buy trade
- Trading Summary: ranging
SUMMARY: ranging
Forum on trading, automated trading systems and testing trading strategies
Sergey Golubev, 2016.12.24 15:04
Japanese Yen Q1 2017 Forecast - Japanese Yen Poised to Gain Further For Three Key Reasons (based on the article)
Fundamental Analysis
- "The Bank of Japan started the year in fairly dramatic fashion as it cut its benchmark interest rate into negative territory, but the BoJ went on to disappoint those looking for further monetary policy easing through the rest of the year. This fact is especially surprising given that National Japanese Consumer Price Index inflation figures showed the country re-entered deflation through the first quarter. It was almost humorous to note the Bank of Japan forecasted inflation would hit 1.7 percent in 2017 while the median private forecast pointed to 0.9 percent growth. Officials finally posted a dramatic cut in inflation and growth forecasts at their July meeting, and further policy easing seemed inevitable."
- "Japan stands to gain if the United States’ Congress and President approve the much-heralded Trans-Pacific Partnership (TPP) trade agreement. Anti-trade sentiment has nonetheless come to the fore ahead of the US Presidential Elections in November, and ratification of the TPP is far from certain. Aggressive currency manipulation from the Japanese Government could further raise the ire of the US politicians and effectively kill the TPP in its tracks. The Japanese MoF has certainly warned it could intervene if the Yen continues to strengthen, but these political calculations make those threats considerably less credible. Failure to act would clear the USD/JPY to break and stay below ¥100."
- "The final wildcard for the Yen is not limited to Japan but especially relevant for its currency: will global financial markets remain stable? The near-term correlation between the USD/JPY exchange rate and the USS&P 500 Volatility Index (VIX)—also known as the “fear index”—recently hit its strongest in two years. The correlation has admittedly been volatile, and the USD/JPY shows little link to the VIX when the VIX is low. The fact the JPY surges (USD/JPY declines) when the VIX spikes higher helps to highlight the fact the Yen tends to strengthen in times of financial market turmoil. The recent jump in S&P volatility coincided with Yen strength, and any similar episodes of sharp S&P declines would also likely coincide with JPY gains."
Technical Analysis
- "USDJPY responded to a critical support confluence in the second half of the year around the 101-handle (100.71-101.26) – this region is defined by the 50% retracement of the 2011 rally, the 1999/2000 lows, former trendline resistance extending off the 1998 & 2007 highs and a median-line extending off the 2009 lows. The exchange rate could not register a weekly close below this mark and as of 12/20 the subsequent rally has marked the largest quarterly advance since Q3 1995 and the largest quarterly range (ATR) since Q4 of 2008. If this was just a zoom & retest of the 2014 breakout, the broader outlook would remain constructive while above this key threshold heading into 2017. Note that a parallel extending off the 2013 highs converges on the June high and highlights possible near-term support at 111.45."
- "The focus heading into Q1 is on a key resistance confluence at 120.18-121.12 where the 2016 open converges on the yearly high-week close, the 78.6% retracement of the 2015 decline, the upper median-line parallel of the embedded ascending structure and basic trendline resistance off the 2015 high. The current rally is at risk heading into this region and we’ll be looking for a pullback to offer favorable long-entries while above confluence support at 111.45."
Forum on trading, automated trading systems and testing trading strategies
Sergey Golubev, 2017.01.04 05:35
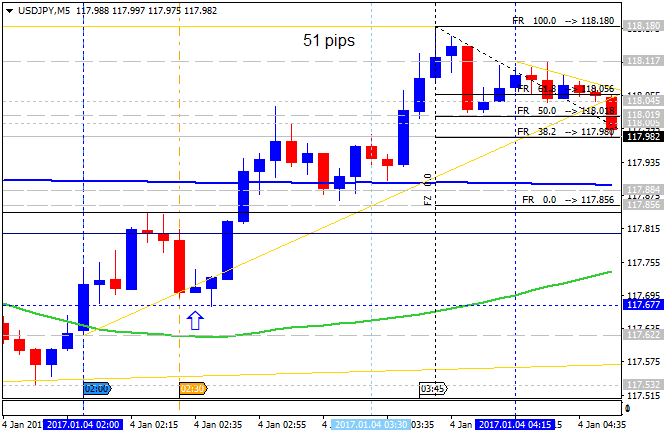
USD/JPY Intra-Day Fundamentals: Nikkei Japan Manufacturing PMI and 51 pips range price movement
2017-01-04 00:30 GMT | [JPY - Manufacturing PMI]
- past data is 51.9
- forecast data is 51.9
- actual data is 52.4 according to the latest press release
if actual > forecast (or previous one) = good for currency (for JPY in our case)
[JPY - Manufacturing PMI] = Level of a diffusion index based on surveyed purchasing managers in the manufacturing industry.
==========
From official report:
- "The headline Nikkei Japan Manufacturing Purchasing Managers’ IndexTM (PMI)TM is a composite single-figure indicator of manufacturing performance. It is derived from indicators for new orders, output, employment, suppliers’ delivery times and stocks of purchases. Any figure greater than 50.0 indicates overall improvement of sector operating conditions."
- "The headline PMI posted 52.4 in December, up from 51.3 in November, signalling a sharper improvement in manufacturing conditions in Japan. In fact, the latest reading was the highest since December last year and contributed to the strongest quarterly average since Q4 2015. The higher figure reflected increases in output, new orders and employment."
==========
USD/JPY M5: 51 pips price movement by Nikkei Japan Manufacturing PMI news event
==========
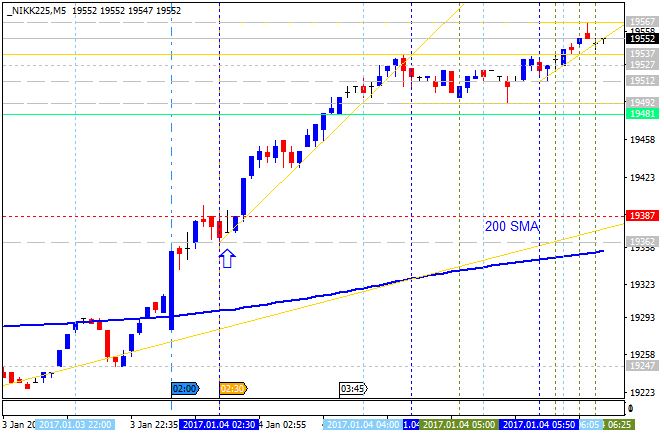
Nikkei 225 Index: pips range price movement by Nikkei Japan Manufacturing PMI news event
Forum on trading, automated trading systems and testing trading strategies
Sergey Golubev, 2017.01.15 06:25
Weekly Fundamental Forecast for USD/JPY (based on the article)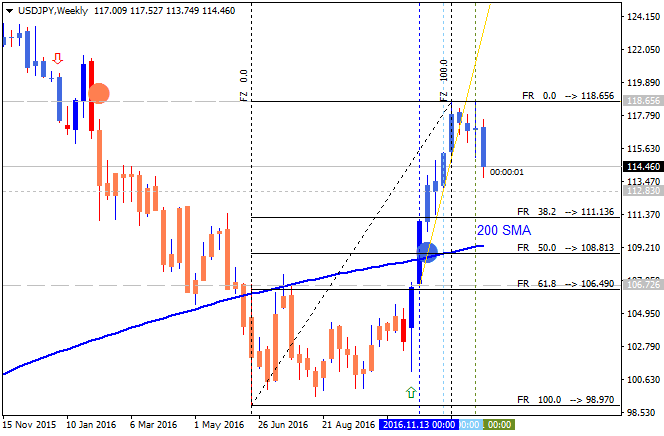
USD/JPY - "Fresh comments from New York Fed President William Dudley, Minneapolis Fed President Neel Kashkari, Chair Janet Yellen and Philadelphia Fed President Patrick Harker may also heighten the appeal of the greenback as the 2017-voting members are scheduled to speak over the days ahead, and the group of central bank officials may endorse a more hawkish outlook for monetary policy as ‘‘the staff's forecast for real GDP growth over the next several years was slightly higher, on balance, largely reflecting the effects of the staff's provisional assumption that fiscal policy would be more expansionary in the coming years.’ In turn, Fed Fund Futures may continue to highlight bets for a June rate-hike, with market participants currently pricing a greater than 60% probability for a move ahead of the second-half of the year, but more of the same from central bank officials accompanied by another set of mixed data prints may drag on interest rate expectations and generate a more meaningful pullback in USD/JPY."
Forum on trading, automated trading systems and testing trading strategies
Sergey Golubev, 2017.01.18 07:07
USD/JPY Technical Analysis: correction to the possible bearish reversal (based on the article)
Daily price is located above Ichimoku cloud in the bullish area of the chart: the price is on breakdown for 112.59 support level to be testing for the breakdown to be continuing.

- "USD/JPY can often act as a helpful proxy as to how the market as a whole is viewing risk. Typically in market sentiment, if USD/JPY is higher, there is a relative sense of calm in markets as JPY is often sold in risk-seeking times. The move higher in USD/JPY after the November 8 election went in line with the aggressive move higher in equities alongside the aggressive sell-off in bonds that helped investors and analysts get a refresher on duration & convexity in fixed income markets."
- "The recent fall in USD/JPY of ~5% has begun to cause traders to question the post-election rally. Unfortunately, there are strong narratives in markets, but no certainties. One of the key narratives is that the new Trump Presidential administration that comes into office this Friday has been riding a fiscal wave to project likely inflation and dollar repatriation that has been perceived to be a net-positive for USD and inflation expectations that have driven USD/JPY higher."
- "However, as the narrative begins to come into question, though many of us at DailyFX believes the Strong-Dollar/ Inflation story resumes later this year, USD/JPY has broken down. From a technical perspective, there is a clear zone of support to watch below the current price of ~113 that is comprised of the Daily Ichimoku Cloud as well as the Fibonacci Zone that we’ve long been watching."
If the price breaks support level at 110.26 on close daily bar so the reversal of the daily price movement to the primary daily market condition will be started.
If not so we may see the ranging condition within the levels.
Forum on trading, automated trading systems and testing trading strategies
Sergey Golubev, 2017.01.24 08:34
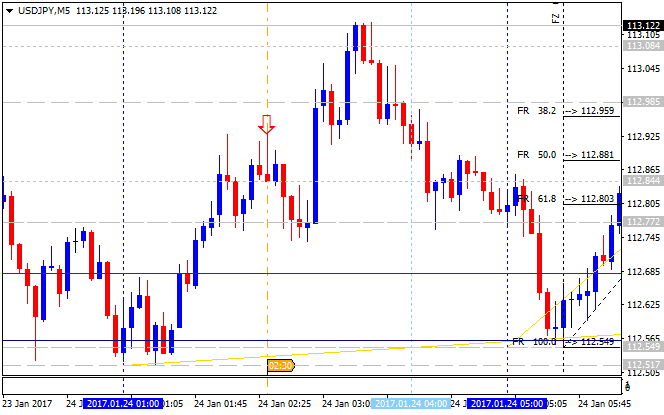
Intra-Day Fundamentals - USD/JPY and Nikkei 225 Index: Nikkei Manufacturing PMI
2017-01-24 00:30 GMT | [JPY - Flash Manufacturing PMI]
- past data is 52.4
- forecast data is 52.3
- actual data is 52.8 according to the latest press release
if actual > forecast (or previous one) = good for currency (for JPY in our case)
[JPY - Flash Manufacturing PMI] = Level of a diffusion index based on surveyed purchasing managers in the manufacturing industry.
==========
From official report:
- "Flash Japan Manufacturing PMI™ at 52.8 in January (52.4 in December), highest since March 2014."
- "Flash Manufacturing Output Index at 53.3 (53.8 in December). Production increases at solid pace."
==========
USD/JPY M5: range price movement by Nikkei Manufacturing PMI news events
==========
Nikkei 225 Index: range price movement by Nikkei Manufacturing PMI news events

Forum on trading, automated trading systems and testing trading strategies
Current Analysis of USD/JPY
Sharif Sajir, 2017.01.24 13:34
USD/JPY: Dollar supported by 112.60
Trade recommendations:
1. Sell — 113.70; SL — 113.90; TP1 — 112.60; TP2 — 112.30.
Forum on trading, automated trading systems and testing trading strategies
Sergey Golubev, 2017.01.25 10:15
USD/JPY - daily ranging in the bullish area; bearish reversal support at 108.18 is the key (based on the article)
Daily price is on bullish ranging condition located above 200 SMA with 112.56 support level to be testing for the secondary correction to be started.
If the price breaks 112.56 support on close bar so the correction within the primary bullish market condition will be started.
If the price breaks 108.18 support level to below on close daily bar so we may see the reversal of the price movement to the primary bearish trend.
If the price breaks 118.65 resistance to above so the primary bullish condition will be resumed.
If not so the price will be on bullish ranging within the levels.
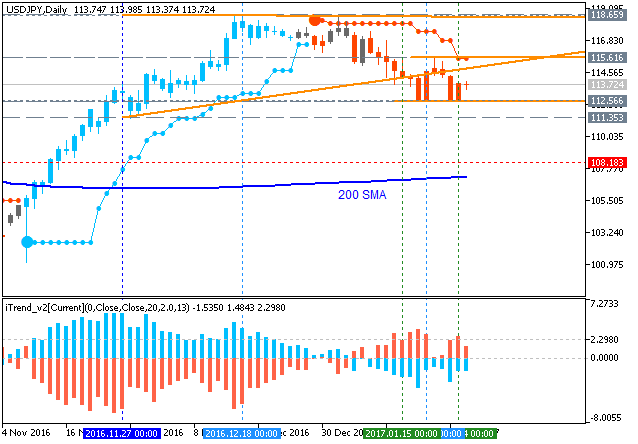
- "4 of the last 6 days have seen time below December low (112.87), including 2 closes. Even so, USD/JPY needs to establish above the 114.80s (12/1 high and December FOMC low) in order to suggest that the month long (and YTD) downtrend is no longer."
Forum on trading, automated trading systems and testing trading strategies
Sergey Golubev, 2017.01.28 15:31
Weekly Fundamental Forecast for USD/JPY (based on the article)
USD/JPY - "With continued strength in Japanese markets, we will likely see the bank shift their yield target higher; but this is unlikely to happen until more-confirmed signs of recovery are seen. The Bank of Japan has been attempting to be more transparent with capital markets as ‘surprise’ moves like enacting negative rates worked out terribly. From a macro-economic standpoint, this recent rally is in the very early, immature stages, with the primary driver being a very unpredictable and unquantifiable variable (Trump); and the Bank of Japan will likely want additional information before making any significant shifts or even signaling such a shift that might potentially hinder the prospects of a continued recovery in Japanese economic activity. The forecast for next week on the Yen will be set to bearish."
Forum on trading, automated trading systems and testing trading strategies
Sergey Golubev, 2017.01.31 06:00
USD/JPY Intra-Day Fundamentals: Bank of Japan Interest Rates and 49 pips range price movement
2017-01-31 02:56 GMT | [JPY - BOJ Policy Rate]
- past data is -0.10%
- forecast data is -0.10%
- actual data is -0.10% according to the latest press release
[JPY - BOJ Policy Rate] = Interest rate levied on excess current account balances held at the BOJ.
==========
From official report:
- "As for the conduct of monetary policy, the Bank will continue with "Quantitative and Qualitative Monetary Easing (QQE) with Yield Curve Control," aiming to achieve the price stability target of 2 percent, as long as it is necessary for maintaining that target in a stable manner. It will continue expanding the monetary base until the year-on-year rate of increase in the observed CPI (all items less fresh food) exceeds 2 percent and stays above the target in a stable manner. The Bank will make policy adjustments as appropriate, taking account of developments in economic activity and prices as well as financial conditions, with a view to maintaining the momentum toward achieving the price stability target."
==========
USD/JPY M5: 49 pips range price movement by Bank of Japan Interest Rates news event

- Free trading apps
- Over 8,000 signals for copying
- Economic news for exploring financial markets
You agree to website policy and terms of use

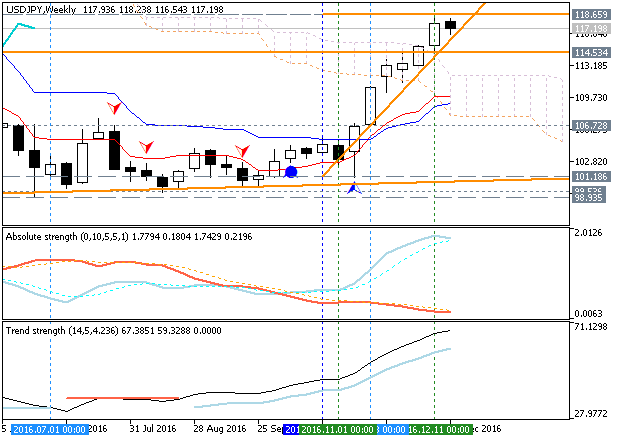
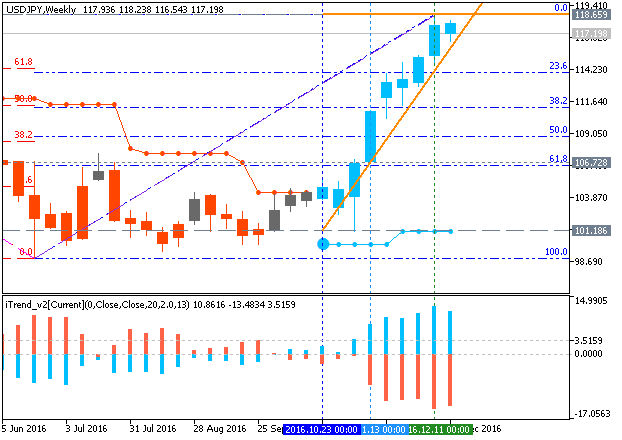
USD/JPY January-March 2017 Forecast: bullish ranging within narrow s/r levels for direction
W1 price is on ranging market condition located above Ichimoku cloud in the bullish area of the chart. The price is on ranging within the following support/resistance levels:
- 118.65 resistance leevel located about Ichimoku cloud in the bullish trend to be resumed, and
- 114.53 support level locxated in the beginning of the correction to be started.
Chinkou Span line is located above the price indicating the ranging bullish condition to be continuing in the future, Trend Strength indicator is estimating the trend as the primary bullish, and Absolute Strength indicator is evaluating the future trend to be ranging bullish. Tenkan-sen line is above Kijun-sen line for the bullish trend to be resumed.Trend:
W1 - ranging bullish