How to identify breakout?
hello,
any link or topic about how to identify BREAKOUTS and HOW TO USE FIBO in trading. Thank you!
hello,
any link or topic about how to identify BREAKOUTS and HOW TO USE FIBO in trading. Thank you!
Forum on trading, automated trading systems and testing trading strategies
newdigital, 2013.11.22 19:06
Breakout with Ichimoku (based on Take Advantage of False Breakouts at Great Prices with Ichimoku article)
Talking Points:
- What is a False Breakout?
- How Ichimoku Can Help You Recognize a False Breakout
- Trading Opportunity in EURUSD with Ichimoku on Recent Move
What is a False Breakout?
A false breakout takes place when price appears to be making a renewed move in the direction of the trend only to be retraced. A trend trader who is looking for prices to eventually move higher but wants confirmation of a price thrust in the direction of the trend is especially prey to false breakouts. This is because a break of resistance like a trendline that is pierced by price without follow through is ground zero to a false breakout.
How Ichimoku Helps You Recognize a False Breakout
Like many pains of trading such as stops getting hit at an unfortunate
price, false breakouts cannot be avoided. However, they can be minimized
as well as become a nice trading signal upon their failure. The reason I
like looking to false breakouts as a trading opportunities is that they
can often have a sharp reversal in the direction of the prior move with
a good risk to reward ratio.
Ichimoku is a technical trading system that helps you catch moves in the direction of the trend on the time frame that you’re trading. Ichimoku is often seen as a difficult system to learn due to the 5 components that are displayed on the chart to explain a trading opportunity but each line serves a purpose and when you understand each purpose, you begin to get a feel for the value that Ichimoku can bring to your technical trading strategy.
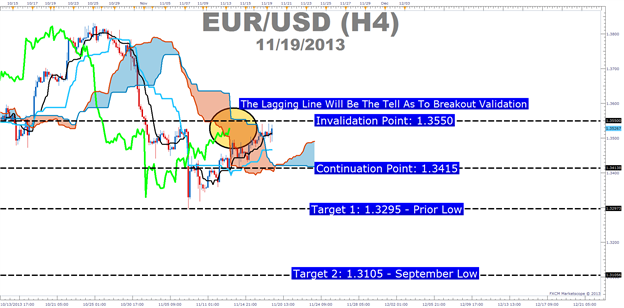
- Ichimoku Trade: Sell EURUSD If Price Breaks Below 1.3415 Showing a False Breakout Occurred
- Stop: 1.3550 (Technical Invalidation Point on the Chart)
-
Limit: 1.3295 (Monthly Low)
If this is your first reading of the Ichimoku report, here is a recap of the traditional rules for a sell trade:
- Price is below the Kumo Cloud (That will be our entry trigger)
- The trigger line (black) is below the base line (light blue) or is crossing below
- Lagging line is below price action from 26 periods ago (bright green line)
- Kumo ahead of price is bearish and falling (red cloud = bearish Kumo)
If the breakout turns out to be legitimate and 1.3550 is taken out, then the next target would be in the neighborhood of 1.3630 /3650 range.
Forum on trading, automated trading systems and testing trading strategies
Indicators: TrendLine Touch Alert
newdigital, 2013.10.24 09:01
Simple Way to Trade Trendline Breakouts
Talking Points:
- Always wait for the current candle to close beyond the trendline to confirm the break.
- Enter into the trade when price retraces back within a few pips of the original trendline, trading in the direction of the original breakout.
- Set your Stop a few pips beyond the trendline and set your Limit at least twice as far as your Stop.
Step 1. - Locating the Trendline
As a review, a trendline is a line connecting two or more lows or two or more highs, with the lines projected out into the future. Traders than look at these projected lines and look for future prices to react around those levels.
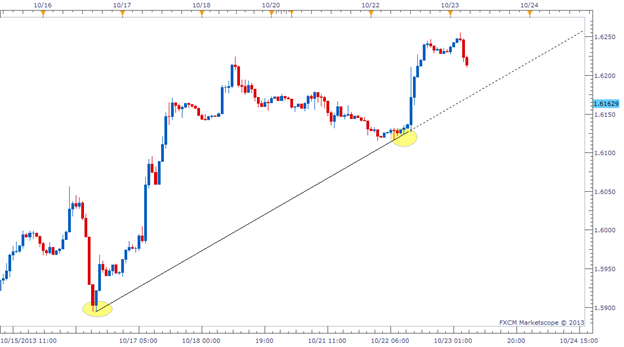
Step 2. – Wait For a Confirmed Breakout
Next, we need to see how the price reacts to the projected trendline.
There are two potential outcomes when price comes into contact with a
trendline:
- The price will bounce off the trendline
- The price will break through the trendline
So we wait to see if the price does in fact break through the price. But we aren’t ready to place a trade just because the price breaks through the trendline. We need to wait and see if the current candle closes beyond the trendline. We require a candle to close beyond the trendline to confirm the breakout. This is a very important rule.

Check out the chart above depicting a trendline on a current USD/JPY
Hourly chart. There were two times in the past week where this trendline
was broken, but look what happened. They were false breakouts. Sellers
were not able to keep the price down below the trendline and both
potential breakout candles closed above the trendline. Had we sold at
either of those two opportunities, we would have been crushed two times
in a row. Something we definitely want to avoid.
So even though it is tempting to get immediately into a trade as price breaks a trendline in real-time, you would be susceptible to false breaks. Patience is a virtue.
Step 3. Set Up The Trade
Remember the first image I showed you of the GBP/USD Hourly chart? Let’s
go back to that example because it actually ended up producing a near
perfect breakout setup. Soon after that snapshot was taken, the GBP/USD
fell and broke through our trendline with authority. A very short time
after that, the Hourly candle closed below the trendline and confirmed
the breakout as well. Once this happened, it was time to get to work to
setup this trade.
There are 3 things we needed to do to execute this breakout trade:
- Set an Entry order to Sell just below the original trendline.
- Attach a Stop order several pips above the trendline.
- Attach a Limit that is as least twice as large as our Stop (increase your trading profitability by learning the importance of the risk/reward ratio).
There is a saying that goes “What once was resistance, can later become support. And what once was support, can later become resistance.” This is the mantra we rely on when setting an Entry order near the original trendline. We are looking for price to retrace back to the point of support/resistance it just broke through, and then continue back into the direction of the original breakout. Take a look at how the trade was setup below.
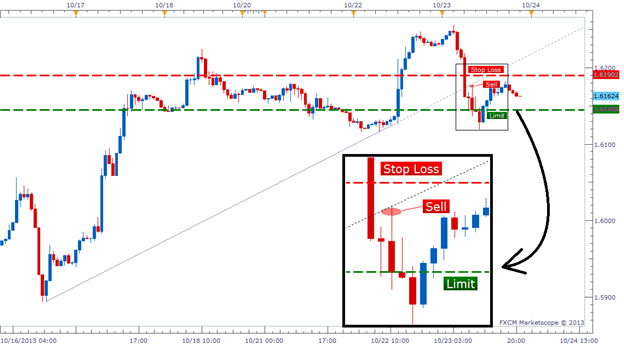
Our Entry order to Sell was placed a couple pips below the trendline,
our Stop Loss was set several pips above the trendline (approx.. 15 pips
from our Entry) and our Limit was set twice as far as our stop (approx.
30 pips from our Entry). Within the next hour, the price retraced back
to the original trendline, and then move back in the direction of
original breakout, exactly what we wanted.
So to recap, we were able to enter into a trade on a confirmed breakout,
we were able to get in at a much more favorable price than entering the
break in real-time, and we were able to set an extremely tight stop
(read: lower our risk) beyond what should be a valid resistance level.
As it turned out, this particular trade was a success, but that
doesn’t mean every trade will be a winner. However, you should take
comfort in the fact that as long as you are using a 1:2 risk/reward
ratio, you only need to be correct 33% of the time to break even. If you
are right more than 33% of the time, you should be a profitable trader
in the long run with this strategy.
Breaking Bad
Trendline breaks can be tricky to trade, but hopefully this article gave
you a clear approach to mastering them. We've learned that you should
always wait for confirmation of a break by requiring the current candle
to close. We also learned placing our Entry order near the trendline
will give us a better entry price and reduce our risk by allowing a
tighter Stop. Setting our Limit as least twice as far as our Stop should
also help shift the odds in our favor. Good luck with your trading!
- Free trading apps
- Over 8,000 signals for copying
- Economic news for exploring financial markets
You agree to website policy and terms of use
hello,
any link or topic about how to identify BREAKOUTS and HOW TO USE FIBO in trading. Thank you!