There is no screenshot.
You are comparing value of the current candle (0) with the of bar 5 ?
gMovingAverage_Orange = NormalizeDouble(iMA (Symbol(), 0, 10, 0, MODE_SMA, PRICE_TYPICAL, 0), Digits);
gMovingAverage_Blue = NormalizeDouble(iMA (Symbol(), 0, 7, 0, MODE_SMMA, PRICE_MEDIAN, 5), Digits);

- Do NOT use NormalizeDouble, EVER. For ANY Reason. It's a kludge, don't use it.
It's use is always wrong
- SL/TP are market orders when triggered, they don't need to be normalized, only abide by the limits Requirements and Limitations in Making Trades - Appendixes - MQL4 Tutorial and that requires understanding floating point equality Can price != price ? - MQL4 forum
- Only the open price for pending orders need to be adjusted. On Currencies, Point == TickSize, so you will get the same answer, but it won't work on Metals. So do it right: Trailing Bar Entry EA - MQL4 forum or Bid/Ask: (No Need) to use NormalizeDouble in OrderSend - MQL4 forum
- Lot size must also be adjusted to a multiple of LotStep. If that is not a power to 1/10 then NormalizeDouble is wrong. Do it right.
Don't use int when you mean boolean int tradeOpen = 1;The trade is not open, you are setting the direction.Use self-documenting variable names bool isLong = true;
iMA (Symbol(), 0, 7, 0, MODE_SMMA, PRICE_MEDIAN, 5)
The Smoothed Moving Average or SMMA - How to Avoid It - NinjaTrader Programming | Big Mike Trading
Do you really want the ma 5 bars back?
Dear WHRoeder,
Thank you SO much for the professional answer.
I have been told since the beginning to use this pain of NormalizeDouble not to get in conversion errors: knowing the parts you just pointed out will hopefully spare me time and pain.
For this first examples, since I only work on currencies, SL=NULL and LotSize=0.05
Shame on me for using an int value when it's actually a bool - heritage of not-so-robust languages - no excuses for that.
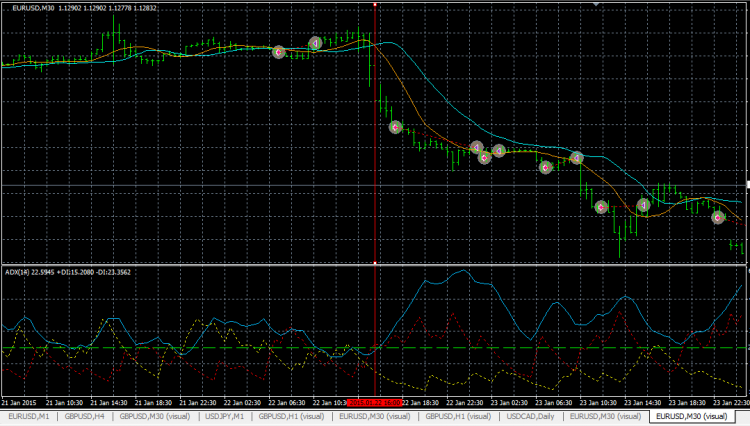
About the MA, I am basically using a MA with period 10 (orange) and another one with period 7 and shift 5 (sort of a modification of the Alligator).
My approach is to get (and learn) something from the theory, while running simulations with different indicators alongside and see if something "talks" to me.
The diagram below (why does "attach file" not work?) shows what I mean: enter the trade when the orange line crosses the blue one downwards. Leave aside the other openings, my point is why it seems to get different values in the code as from what we can see.
This is NOT the only example: this is just the last (easy) one: how can I "visually" find a strategy if when I implement it the result is considerably different?
(still, not saying my strategies will be perfect, but consider the profit it lost for not opening when it should have (red bar), multiply for 2 months simulation and a simple strategy with 55% reward could have probably been way better)
By the way...
gLastTick is simply taken from:
[PHP]SymbolInfoTick(Symbol(), gLastTick)[/PHP]
I spot something that rings a (noob) bell: each order seems to be shifted by a couple of bars.
Could it be a reason that many indicators need 2 bars to be consolidated?
Any ideas?
- Free trading apps
- Over 8,000 signals for copying
- Economic news for exploring financial markets
You agree to website policy and terms of use

Foreword: I am quite new to THIS programming language.
I have the impression that, for most indicators, what I see on the graph is not what I am getting in the code. So, before I might move to complex logic, I went back to the simple cases as I’d need to understand the basis with simple examples I guess.
Can someone cast some light over that?
I will clarify them with the simple example I am experimenting now:
To put it simple, I consider two Moving Averages, open trade (SELL) when Orange one is less than the Blue one and DX- is greater than 23.
CLOSE trade when a bar crosses the Orange line.
The (extract of) code is:
Result is in the screenshot, which makes me wonder what the hell is going on... according to what I see it should open the trade where the bar is!
Thanks