- ThirdBrainFx Market Commentary
- New Members introduction
- The Sad Facts on Trading
EURUSD Outlook
I think the EURUSD is nearing a critical resistance zone at around the 1.3770/80 level. This area represents a major overlap junction where the sellers are expected to return. There is also an up-move channel formed by the pair on the 4 hour chart, as shown below. The channel resistance level coincides with the mentioned area. So, we can say that there is a confluence of resistances around the same region.
Only a break and close above the 76.4% fib level will increase the bullish pressure on the pair. And, then the buyers might try to push the pair towards the 1.3890 level again. So, I am watching this level very closely in the short term.
Thanks for sharing your views man. It was very useful for me. Especially the chart which you have shared saved me and stopped me from doing a blunder. I was planning on buying the EURUSD yesterday at the current level. However, I stopped after I look into the chart you shared.
I have also plotted the same trend line on my chart as well. Now, I am also monitoring this trend line very closely. BTW do you think that the pair can manage to break higher above this trend line? Or do you think the pair might continue to trade lower from the current levels? Please share your views. Thanks a lot.
Anytime sanjusharmaDHP. I am glad that the analysis was useful. Most important thing is that it saved some bucks. However, we need to be careful here in the short term. As I shared earlier, there is a channel forming. The upper resistance zone proved vital, and now the pair is coming close to the channel support area.
There is also a critical swing support at around the 1.3680/60 levels. The sellers might find it hard to break this support area in one go. So, we may witness some consolidation. I am not sure here. And, one of my rules is that when I am not sure, I stay away for some time. So, I will wait for some time and monitor price action carefully. Thanks.
New Zealand Trade Balance May Push the NZD/CAD Price Out of its Current Narrow Range This Week
Although Monday would be a bank holiday in some of the major economies around the world, including the United States, there are some major data releases scheduled in the coming few days to move the global Forex markets.
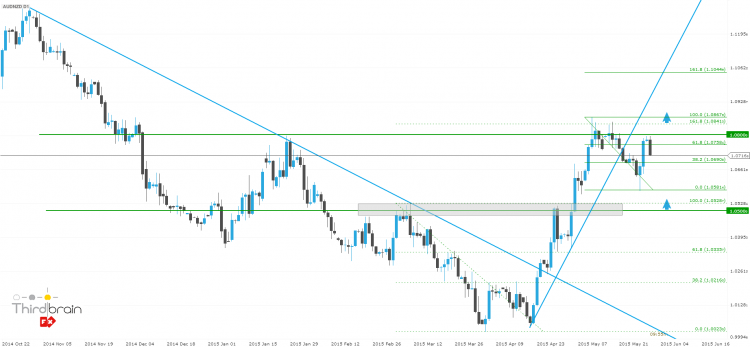
AUD/NZD Reached Our Bullish Target, May Move Further Up Amid Continued Fall in the GDT Price Index
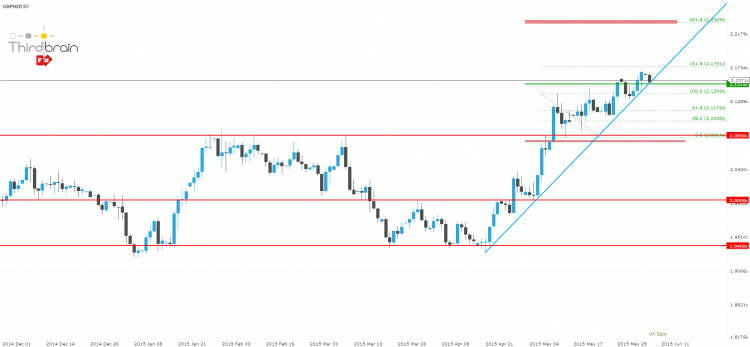
GBP/NZD is Trading Near Uptrend Line after Reaching Our Profit Target
USD/CAD Appears Bearish Amid Lower than Expected Empire State Manufacturing Index Reading
At 12:30 p.m., the Statistics Canada released the month-over-month manufacturing sales data, which measures the changes in the total value of sales made by national manufacturers over the past month in Canada.
As manufacturers are the first to get affected by changing market conditions, any sudden shift in the manufacturing sales can indicate future corporate economic activity, including expenditure, job creation, and capital investments. Hence, Forex traders consider the manufacturing sales data to be an important leading indicator of the Canadian economy.
In May, the Canadian manufacturing sales (m/m) figure increased by 2.7% and the forecast for June was set at a decrease of 1.3%. However, the actual data suggested that manufacturing sales have gone down as much as 2.1% over the past month.
At 12:30 p.m., the Federal Reserve Bank of New York also released its empire state manufacturing index reading, which measures the level of a diffusion index by surveying 200 manufacturers in the state of New York.
The survey asks respondents to rate the relative level of overall business conditions in New York. Since New York’s economy has a large contribution to the overall US economy, Forex market participants consider the empire state manufacturing index for New York to be an important signal of the overall US economy.
Last month, the empire state manufacturing index reading came out at 3.1, and the forecast for June was set at 5.8. The actual index reading, however, came out way below the forecast, at negative 2.0, indicating deteriorating conditions.
USD/CAD Outlook
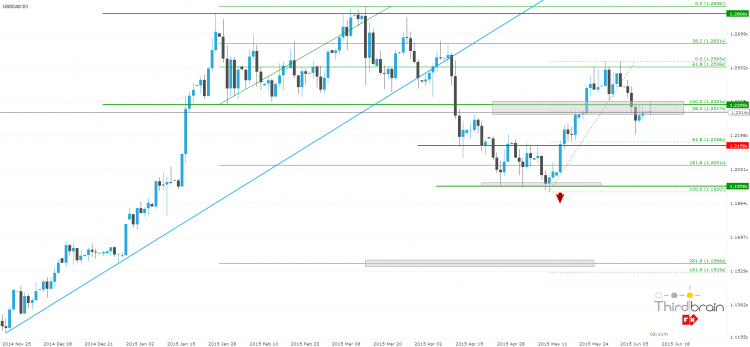
Since the USD/CAD broke below the long-term upward sloping trend line on April 5, the momentum had remained largely bearish. After the USD/CAD price reached the 161.8% Fibonacci extension level of the range between 1.2350 and 1.2836 in the end of April, it retraced back towards the 61.8% retracement level of this range in June.
However, the USD/CAD price formed a double top pattern on June 5, and resumed the downtrend over the last week and closed below the important resistance level around 1.2350. Today, the USD/CAD price once again was rejected around 1.2350, and currently it is trading near the 38.2% Fibonacci level of the last upward swing towards 1.2563.
As the empire state manufacturing index reading came out way lower than the forecast, the fundamental outlook for the USD/CAD is would be bearish over the next few days. Under the circumstances, if the USD/CAD price breaks below last week’s low, at 1.2200, it is likely to travel further south this week.
TRADING ADVICES
Short Trade Setup:
Money Management Advice
Position Size Suggestion based on 2% of Equity using the Percentage Risk Model (PRM)
For Account Size: US$ 1,000, position size should be 0.28 lots (mini)
For Account Size: US$ 5,000, position size should be 1.4 lots (mini)
For Account Size: US$ 10,000, position size should be 2.8 lots (mini)
Orders
Pending Sell Stop Entry: 1.2190
Stop Loss: 1.2365
Take Profit: 1.1960
- Free trading apps
- Over 8,000 signals for copying
- Economic news for exploring financial markets
You agree to website policy and terms of use


