Hi,
Is it possible to get the crossing of two lines of two different indicators ?
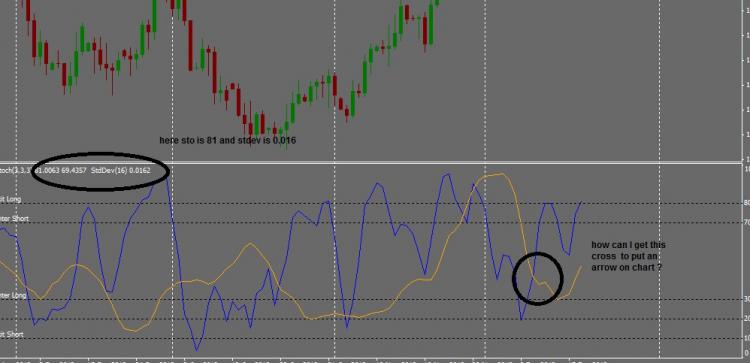
I would like to get the crossing of stochastic and standard deviation. There must be a way as the lines do cross on the screen.
I know how to do it with stochastic/rsi/wpr or ma's etc. but this one got me blocked.
Any help would be greatly welcome.
What is a cross of two lines A & B ? at the bar to the left of the bar where they cross A > B or B > A at the bar to the right of the bar where they cross B > A or A > B . . . you need 3 bars to check for a cross, although many do it in two bars there are situations where you can definitively determine a cross from looking at two bars. So to look for your cross, check each bar in turn by looking at A & B for the bar before and the bar after the bar in question . . .
Yes but the values are different if I get say stochastic it comes back 50 whilst std 0.0014 so I can't compare the values. One is rangebound and the other one is not. I can tell if one or both have increased/decreased but that doesn't tell me if they crossed.
Sorry for being thick and thank you for the help.
Yes but the values are different if I get say stochastic it comes back 50 whilst std 0.0014 so I can't compare the values. One is rangebound and the other one is not. I can tell if one or both have increased/decreased but that doesn't tell me if they crossed.
You said the lines cross on the screen . . . . so at the point they cross they MUST have the same value . . . then you say that one is 50 and the other is 0.0014 so that means they do not cross on screen. Perhaps you should post a screen shot . . .
Thank you for your time. This is what I'm trying to do.
pic
OK, they are working on different Y axis scales, I don't see how you can accurately determine a cross and any cross is arbitrary and determined by the Y axis scaling applied to each Indicator.
Isn't it possible to get a change of colour at x/y of the screen itself rather than of indicators ?
Many thanks for your time and help.
Thank you.
- Free trading apps
- Over 8,000 signals for copying
- Economic news for exploring financial markets
You agree to website policy and terms of use

Hi,
Is it possible to get the crossing of two lines of two different indicators ?
I would like to get the crossing of stochastic and standard deviation. There must be a way as the lines do cross on the screen.
I know how to do it with stochastic/rsi/wpr or ma's etc. but this one got me blocked.
Any help would be greatly welcome.