Is it possbile to set a different color for all (trend)lines in the chart at once (maybe a script)?
If you're a programmer or learning to program then use the available mql4 function to accomplish the task. Otherwise you can make a request here and someone will help you with that.
Here are the list of object functions. https://docs.mql4.com/objects/ObjectCreate. On the left column. Generally you search for the object just like searching for orders. You ObjectGet() the Property_Color && Property_TrendLine for Checking. Then you ObjectSet() to what you want.
Hi ubzen,
yes, I am learning to program. But it could have been that a script like this already exists and that somebody could upload it here.
But nevertheless thank you for the advice, I will try my best to create a script.
Obviously not as easy as I thought. But maybe you can give me a tip?
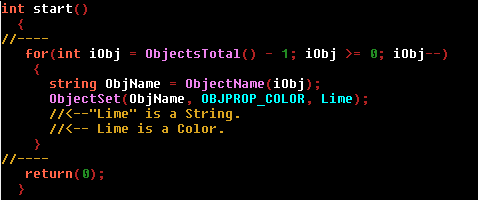
It is not important for me what kind of line it is. I just look for every object and set the color to Lime. But when I drag this script into the chart the lines become black. I have no idea why because I don't see a logical problem. Could it be wrong syntax? But the function ObjectSet() is not so difficult to understand. So I have no idea where the problem is... :-/
//+------------------------------------------------------------------+
//| script program start function                                    |
//+------------------------------------------------------------------+
int start()
  {
//----
   for(int iObj = ObjectsTotal() - 1; iObj >= 0; iObj--)
    {
      string ObjName = ObjectName(iObj);
      ObjectSet(ObjName, OBJPROP_COLOR, "Lime");
    }
//----
   return(0);
  }
//+------------------------------------------------------------------+
It is not important for me what kind of line it is. I just look for every object and set the color to Lime. But when I drag this script into the chart the lines become black. I have no idea why because I don't see a logical problem. Could it be wrong syntax? But the function ObjectSet() is not so difficult to understand. So I have no idea where the problem is... :-/

Thanks!! It works now! :)
*PROUD* :D
Thanks!! It works now! :)
*PROUD* :D
Hi ubzen,
I don't wanted to open a new thread for that because we were just "talking" about objects.. I would like to color the distance between two moving averages.
For example, I use the EMA20 and the EMA50. When the EMA20 is above the EMA50 I want the space between them colored in green, other wise in red.
Do I have to do this with objects or with buffers? I have no idea what to use now. I am pretty sure that I find an indicator like this but I would like to program it myself.
Therefore I would appreciate it, if you tell me what to use. Then I know in which "direction" I have to think.
Thank you!!
- Free trading apps
- Over 8,000 signals for copying
- Economic news for exploring financial markets
You agree to website policy and terms of use
Hi Forum,
I use many horizontal / trendlines in my chart and sometimes I like to change the colors of them. It is really much work when you have to do it with 15 charts.
Therefore I wanted to know if it is possible to set a new color for all lines in the chart with a script. Maybe somebody already has something like this? My searching was not successful...