The situation was not changed so much since yesterday Monday for example :
1. D1 timeframe is still on bearish
MetaTrader Trading Platform Screenshots
MetaQuotes Software Corp., MetaTrader 5, Demo
USDCAD D1 bearish

2. H4 timeframe : flat is finishing with bearish market continuing
MetaTrader Trading Platform Screenshots
MetaQuotes Software Corp., MetaTrader 5, Demo
USDCAD H4 : bearish started after flat

I want to remind that we are having NFP today (this is highest impacted news event which affected on all the pairs) :
2013-10-22 12:30 GMT (or 14:30 MQ MT5 time) | [USD - Non-farm Payrolls]
newdigital, 2013.10.22 14:49
2013-10-22 12:30 GMT (or 14:30 MQ MT5 time) | [USD - Non-farm Payrolls]
- past data is 193K
- forecast data is 180K
- actual data is 148K according to the latest press release
if actual > forecast = good for currency (for USD in our case)
==========
September Nonfarm Payrolls Miss 148K vs Exp. 180K; Unemployment Rate Drops to 7.2%
September jobs are a disappointment at 148K vs expectations of 180K and private jobs only 126K well below the 180K expected, but August was revised higher this time, from 169K to 193K. Net for the two months, largely a wash.
The unemployment rate, at 7.2 percent, changed little in September but has declined by 0.4 percentage point since June. The number of unemployed persons, at 11.3 million, was also little changed over the month; however, unemployment has decreased by 522,000 since June.Among the major worker groups, the unemployment rates for adult men (7.1 percent), adult women (6.2 percent), teenagers (21.4 percent), whites (6.3 percent), blacks (12.9 percent), and Hispanics (9.0 percent) showed little or no change in September. The jobless rate for Asians was 5.3 percent (not seasonally adjusted), little changed from a year earlier.
In September, the number of long-term unemployed (those jobless for 27 weeks or more) was little changed at 4.1 million. These individuals accounted for 36.9 percent of the unemployed. The number of long-term unemployed has declined by 725,000 over the past year.
Both the civilian labor force participation rate, at 63.2 percent, and the employment-population ratio at 58.6 percent, were unchanged in September. Over the year, the labor force participation rate has declined by 0.4 percentage point, while the employment- population ratio has changed little.
The number of persons employed part time for economic reasons (sometimes referred to as involuntary part-time workers) was unchanged at 7.9 million in September. These individuals were working part time because their hours had been cut back or because they were unable to find a full-time job.
Total nonfarm payroll employment increased by 148,000 in September, with gains in construction, wholesale trade, and transportation and warehousing. *Over the prior 12 months, employment growth averaged 185,000 per month.
MetaTrader Trading Platform Screenshots
MetaQuotes Software Corp., MetaTrader 5, Demo
USDCAD M5 with NFP

newdigital, 2013.10.23 16:21
2013-10-23 14:00 GMT (or 16:00 MQ MT5 time) | [CAD - Overnight Rate Target]
- past data is 1.00%
- forecast data is 1.00%
- actual data is 1.00% according to the latest press release
if actual > forecast = good for currency (for CAD in our case)
==========
Bank of Canada maintains overnight rate target at 1 per centThe Bank of Canada today announced that it is maintaining its target for the overnight rate at 1 per cent. The Bank Rate is correspondingly 1 1/4 per cent and the deposit rate is 3/4 per cent.
The global economy is expected to expand modestly in 2013, although its near-term dynamic has changed and the composition of growth is now slightly less favourable for Canada. The U.S. economy is softer than expected but as fiscal headwinds dissipate and household deleveraging ends, growth should accelerate through 2014 and 2015. The nascent recovery in Europe, while modest, has surprised on the upside. China’s economy is showing renewed momentum, while growth in a number of other emerging market economies has slowed as their financial conditions have tightened. Overall, the global economy is projected to grow by 2.8 per cent in 2013 and accelerate to 3.4 per cent in 2014 and 3.6 per cent in 2015.
In Canada, uncertain global and domestic economic conditions are delaying the pick-up in exports and business investment, leaving the level of economic activity lower than the Bank had been expecting. While household spending remains solid, slower growth of household credit and higher mortgage interest rates point to a gradual unwinding of household imbalances. The Bank expects that a better balance between domestic and foreign demand will be achieved over time and that growth will become more self-sustaining. Real GDP growth is projected to increase from 1.6 per cent in 2013 to 2.3 per cent in 2014 and 2.6 per cent in 2015. The Bank expects that the economy will return gradually to full production capacity, around the end of 2015.
MetaTrader Trading Platform Screenshots
MetaQuotes Software Corp., MetaTrader 5, Demo
USDCAD M5 : 54 pips price movement by CAD - Overnight Rate Target

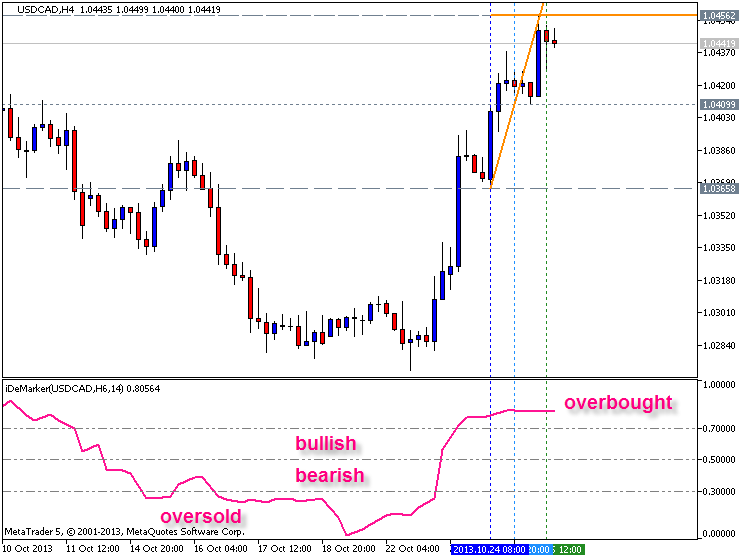
The name of the thread is USDCAD Technical Analysis 20.10 - 27.10 : Bearish before Rally? so we are having this rally now :
Market Condition Evaluation based on standard indicators in Metatrader 5
newdigital, 2013.01.22 14:18
So, just to summarize few pages on this topic onto 1 comment:
1. Trend following
1.1. Primary trend
- Uptrend (bullish)
- Downtrend (bearish)
1.2. Secondary trend.
- Correction
- Bear Market Rally
2. Overbough/oversold ('top-and-bottom')
3. Breakout
There are some more: flat (or non-trading market condition), and ranging market condition. Some people say that flat and ranging are part of secondary trend together with correction and bear market rally; the other people are talking about flat and ranging as separated market condition which can be under item #4 (flat) and item #5 (ranging). I think, the true may be the following: flat and ranging are the part of secondary trend under trend following. If yes so the resultant classification may be the following:
1. Trend following
1.1. Primary trend
- Uptrend (bullish)
- Downtrend (bearish)
1.2. Secondary trend.
- Correction
- Bear Market Rally
- Flat (non-trading)
- Ranging
2. Overbough/oversold ('top-and-bottom')
3. Breakout
newdigital, 2013.10.24 15:13
2013-10-24 12:30 GMT (or 14:30 MQ MT5 time) | [USD - Trade Balance]
- past data is -38.65B
- forecast data is -39.50B
- actual data is -38.80B according to the latest press release
if actual > forecast = good for currency (for USD in our case)
==========
U.S. Trade Deficit Widens Less Than Expected In August
With the value of imports and exports showing little change in the month of August, the Commerce Department released a report on Thursday showing that the U.S. trade deficit for the month widened only slightly.
The report said the trade deficit ticked up to $38.8 billion in August from a revised $38.6 billion in July. Economists had expected the deficit to widen to $40.0 billion from the $39.1 billion originally reported for the previous month.
The Commerce Department said the value of imports was virtually unchanged at $228.0 billion, while the value of exports edged down to $189.2 billion from $189.3 billion.
newdigital, 2013.10.24 15:21
2013-10-24 13:00 GMT (or 15:00 MQ MT5 time) | [USD - Markit Manufacturing PMI]
- past data is 52.8
- forecast data is 52.5
- actual data is 51.1 according to the latest press release
if actual > forecast = good for currency (for USD in our case)
==========
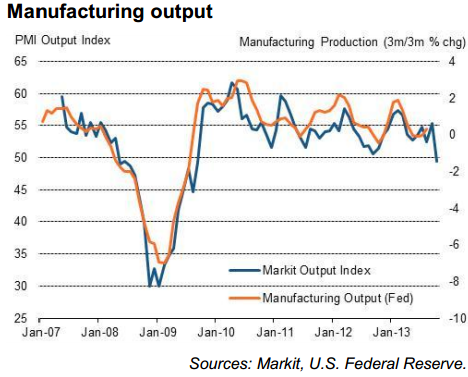
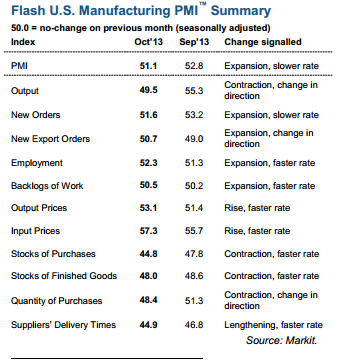
US: Markit Manufacturing PMI fell to 51.1 in October

The advanced gauge of the manufacturing PMI sponsored by Markit dropped
to 51.1 for the month of October, missing the median at 52.5 and down
from September’s 52.8

MetaTrader Trading Platform Screenshots
MetaQuotes Software Corp., MetaTrader 5, Demo
+7 and -8 price movement by USD - Trade Balance and USD - Markit Manufacturing PMI

newdigital, 2013.09.20 13:17
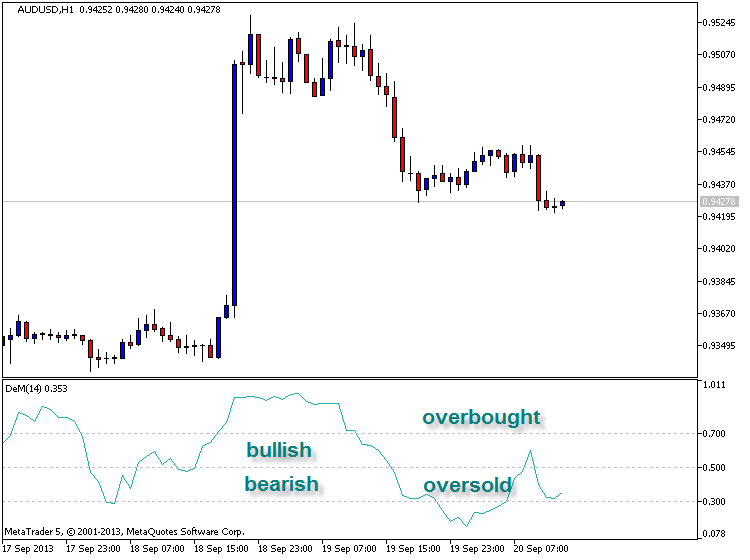
The DeMarker indicator named after Thomas DeMark is a momentum oscillator very similar in nature to the Relative Strength Index (RSI) developed by Welles Wilder. By comparing inter-period price maxima and minima the DeMarker indicator attempts to gather information about price movements to help determine the underlying trend strength and identify over-bought/sold trade conditions. One of the main benefits of the DeMarker indicator like the RSI is that they are less prone to distortions seen in indicators such as the Rate of Change (ROC), which are introduced by erratic price movements at the start of the analysis window which can cause sudden shifts in the momentum line even when the current price is little changed.
The Default time span for the calculation of the DeMarker indicator is 14 periods. The overbought and oversold lines are typically drawn at 0.7 and 0.3, respectively. Longer time spans in the calculation will result in shallower swings in the oscillator and vice versa, accordingly traders may wish to construct narrower overbought and oversold lines for longer time periods. DeMarkers based on short time spans experience greater volatility and are more suitable for indicating overbought and oversold conditions, whereas longer time spans with more stable trajectories are better suited for constructing trend-lines and analyzing price patterns.

Traders should look to go long when the DeMarker falls below 0.3 and rises back above it or where there is a bullish divergence with price where the first trough is below 0.3. Traders should look to go short when the DeMarker rises above 0.7 and falls back below it or where there is a bearish divergence with price where the first peak is above 0.70. Failure swings (see RSI for example of a failure swing) strengthen other signals.
Trade Signals- Trending Markets
Traders should look to go long during an up-trend, when the DeMarker
falls below 0.4 and rises back above it and go short in a down trend
when the DeMarker rises above 0.6 and falls back below it. Traders may
wish to take profit on divergences or exit using a trend indicator.
Traders should avoid selling/buying at overbought/oversold levels in
strongly trending markets as subsequent periods of sideways trading can
return the oscillator to more normal levels without any material
favourable movement in the direction of the trade.

- Free trading apps
- Over 8,000 signals for copying
- Economic news for exploring financial markets
You agree to website policy and terms of use

Primary bearish is going on for the second week - price D1 is below Ichimoku cloud, and AbsoluteStrength indicator is showing the bearish market condition as a strong downtrend.
But Chinkou Span line is very close to historical D1 price ready to be reversed to secondary bear market rally. If the price will cross 1.0280 support level so the bearish trend will be continuing for at least the beginning of this week.
On W1 timeframe - Chinkou Span line is coming to the price from above to below which is indicating future possible breakdown so if it will be happened - we will be able to see good downtrend in the end of this month.
UPCOMING EVENTS (high/medium impacted news events which may be affected on GBPUSD price movement for this coming week)
2013-10-21 12:30 GMT (or 14:30 MQ MT5 time) | [CAD - Wholesale Sales]
2013-10-21 14:00 GMT (or 16:00 MQ MT5 time) | [USD - Existing Home Sales]
2013-10-22 12:30 GMT (or 14:30 MQ MT5 time) | [CAD - Retail Sales]
2013-10-22 12:30 GMT (or 14:30 MQ MT5 time) | [USD - Non-farm Payrolls]
2013-10-23 14:00 GMT (or 16:00 MQ MT5 time) | [CAD - Overnight Rate Target]
2013-10-24 01:45 GMT (or 03:45 MQ MT5 time) | [CNY - HSBC Flash Manufacturing PMI]
2013-10-25 12:30 GMT (or 14:30 MQ MT5 time) | [USD - Durable Goods Orders]
Please note : some US high impacted news events (incl speeches) are also affected on USDCAD movement
SUMMARY : possible rally
TREND : bearish
Intraday Chart