Just searched and found this interesting:
"And indeed, the SMMA when used with a Period n returns the same result as an EMA, when used with a period 2*n – 1. For example, the following equalities apply:
SMMA (12) = EMA(23)
SMMA (13) = EMA(25)
SMMA (14) = EMA(27)"
Hi,
I want to put SMMA(8) of H4 chart to M15 chart.
Simply use SMMA(128) (8*16) is not correct. Is it possible to code this?
The problem is: I don't want to use "iMA" function, because this code will be used in Stratedgy Tester Visual Mode, it'd better if different timeframe data not quoted.
- The Smoothed Moving Average or SMMA - How to Avoid It - NinjaTrader Programming | Big Mike Trading Use EMA instead (one half SMMA periods)
- Find the MTF MA indicator. A MA (x) of H4 is NOT the same as MA(16x) of M15.
- If you want to use iMA, you don't need the MTF indicator. (If you want to display the line either MTF or my Polyline code)
I don't understand you last sentence . . . you start saying you want to put the SMA on your chart and then say you don't . . .
WHRoeder:
....
Find the MTF MA indicator. A MA (x) of H4 is NOT the same as MA(16x) of M15
Found this "MTF_MA-4H.mq4" and tried, exactly what I wanted.
I'll look into its code.
Thanks, man!
int      shift   = ...;
datetime when    = Time[shift];
int      shiftH4 = iBarShift(NULL, PERIOD_H4, when);
double   ma      = iMA(NULL, PERIOD_H4, .... shiftH4); // Not shift
Thanks.
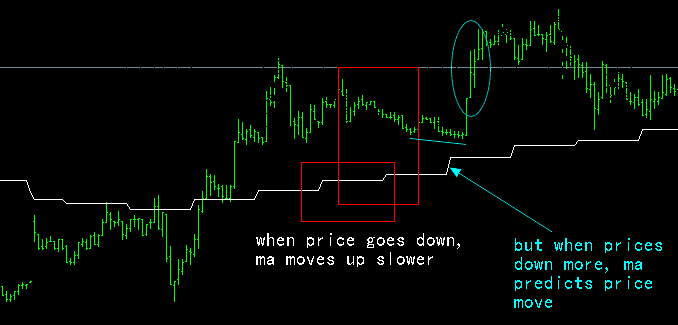
I tried both the downloaded "MTF_MA-4H.mq4" and the code with "adjusting shift" you mentioned. Both work fine with normal chart, but when put in Stratedgy Tester mode, both have problem with the last several bars (forming the latest H4 bar) -- predicts future prive move.
Let me explain with a picture, M15 chart, which is not the case of last bars, but can explain.

Any idea?
Exactly what it should be doing. Price is NOT moving down. It is constant (the close) on the H4 chart. That is why the MA doesn't move (stair step) until the next H4 bar.
And a MA doesn't predict ANYTHING. It summarizes what has been. Your image (at the arrow) shows that the last four H4 closes were above its MA. So Of course it's moving up.
Take a screen shot of the H4 with same MA and stretch it horizontally to match your M15 and compare them.
Thinking about it again, I guess it's like this : ma(H4) is calculated with CLOSE price, which is the end of each bar. So if M15 chart quotes that ma(H4) value, in the process of finishing/forming each H4 bar, prediction happens.
- Free trading apps
- Over 8,000 signals for copying
- Economic news for exploring financial markets
You agree to website policy and terms of use
Hi,
I want to put SMMA(8) of H4 chart to M15 chart.
Simply use SMMA(128) (8*16) is not correct. Is it possible to code this?
The problem is: I don't want to use "iMA" function, because this code will be used in Stratedgy Tester Visual Mode, it'd better if different timeframe data not quoted.
Thanks.