Indicator period_m1 is not drawn on a backtest with 5 minute choosen as time period
I want to draw the momentum using period_m1 when backtesting with 5 minute choosen as time period.
Problem: Momentum period_m1 is only drawn if I backtest with 1 minute choosen as time period.
Has someone an idea how this could work?
Thanks in advance!
Forget backtesting . . it doesn't work on a live chart.
Try this . . .
Buf_0[i]=iMomentum(NULL,PERIOD_M1,14,PRICE_CLOSE, i );
Try this . . .
Buf_0[i]=iMomentum(NULL,PERIOD_M1,14,PRICE_CLOSE, i*Period() );

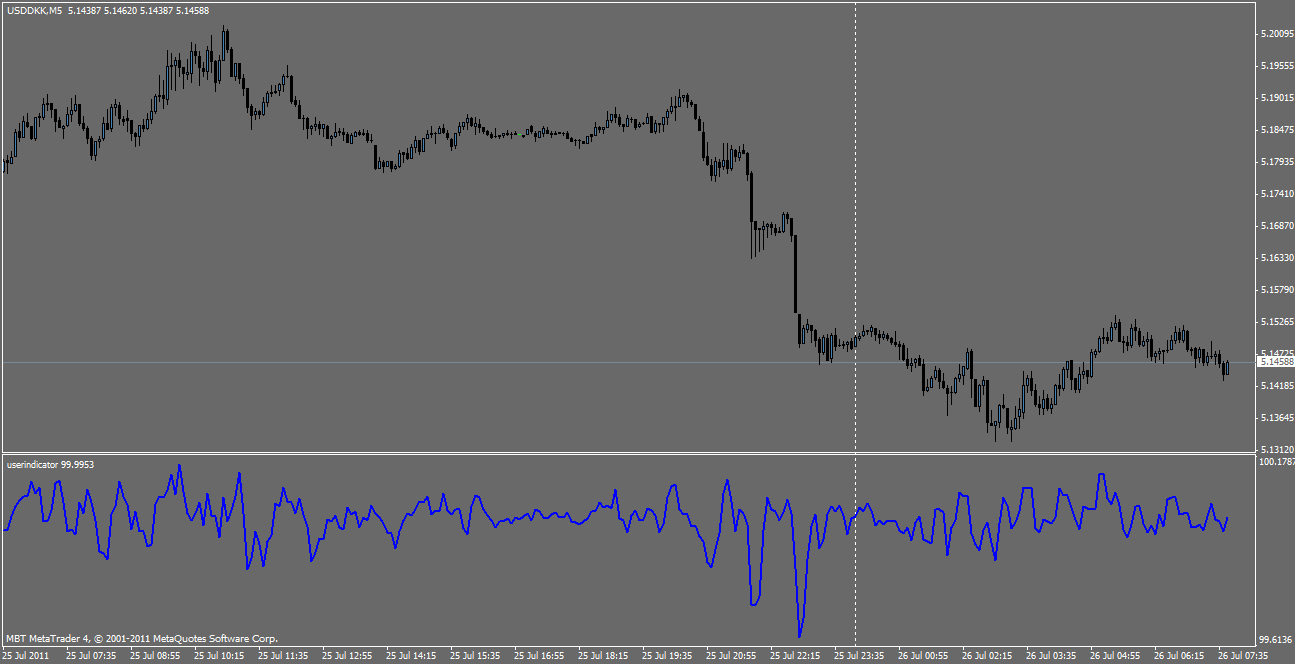

It draws a graph before I start the backtest. But the momentum´s values are different (test 1: 1 minute, test2:5 minute). When I start the backtest, a horizontal line is drawn.
Is it only a problem for MT to visualize the graph? Then at least I could use the data. The idea is to open an order on a higher timeframe when the price breaks out of a channel and to analyze the following movement depending on a smaller timeframe.
You are testing on M5 data, how should MT4 calculate M1?
Instead you have to start your test on M1 chart and internally get the values from higher timeframes (which is possible). The other way, (getting values from lower timeframes) is not possible
hi zzuegg!
Using
double Min_15 = iMomentum(NULL,PERIOD_M15 ,20,PRICE_CLOSE,1);

double H1 = iMomentum(NULL,PERIOD_H1 ,20,PRICE_CLOSE,1);

Alert("Min_15: ",Min_15," Min_60: ",H1);
delivers results for H1 an Min_15. On 15 minute timeframe and on 1 h timeframe.
The Problem seems to be the drawing of the results via an indicator. Another option would be to export the results to excel and to draw the graph there. But that would be very uncomfortabel :/
hi zzuegg!
The Problem seems to be the drawing of the results via an indicator. Another option would be to export the results to excel and to draw the graph there. But that would be very uncomfortabel :/
If you are drawing the Indicator on an M15 chart you can only plot points at the M15 time intervals . . . i.e. every 15 mins, hence my change to your code . . .
Buf_0[i]=iMomentum(NULL,PERIOD_M1,14,PRICE_CLOSE, i*Period() );
because you are looking at a sample size of 14 the sample boundaries from M1 to M15 will probably not synchronise. Try a sample size of 15, you may well get a better match . . .
If you are drawing the Indicator on an M15 chart you can only plot points at the M15 time intervals . . . i.e. every 15 mins, hence my change to your code . . .
because you are looking at a sample size of 14 the sample boundaries from M1 to M15 will probably not synchronise. Try a sample size of 15, you may well get a better match . . .
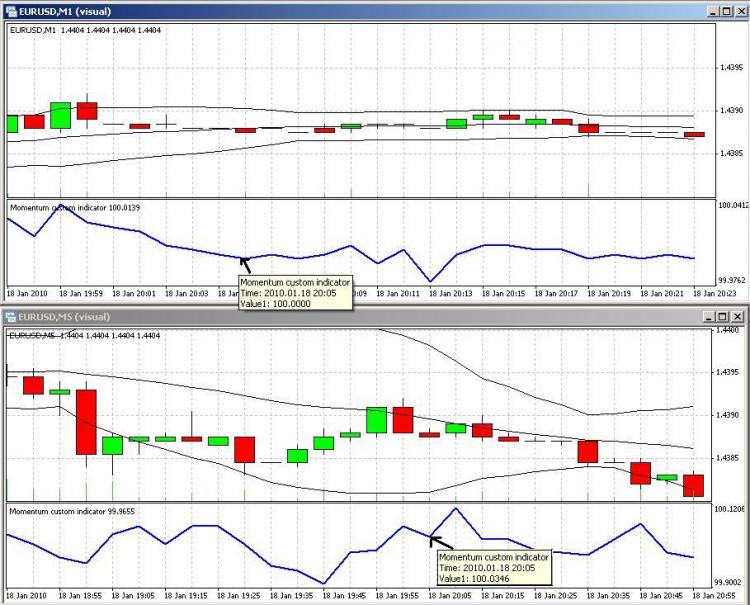
I used your code
Buf_0[i]=iMomentum(NULL,PERIOD_M1,14,PRICE_CLOSE, i*Period() );and I got what I´ve shown above . Don´t know exactly what you mean with a sample size of 15?
I used your code
and I got what I´ve shown above . Don´t know exactly what you mean with a sample size of 15?
By Sample size I was talking about the "Period - amount of bars for calculation of price changes" . . .
iMomentum( string symbol, int timeframe, int period, int applied_price, int shift)| symbol | - | Symbol the data of which should be used to calculate indicator.NULL means the current symbol. |
| timeframe | - | Timeframe. It can be any of Timeframe enumeration values. 0 means the current chart timeframe. |
| period | - | Period (amount of bars) for calculation of price changes. |
| applied_price | - | Applied price. It can be any of Applied price enumeration values. |
| shift | - | Index of the value taken from the indicator buffer (shift relative to the current bar the given amount of periods ago). |
- Free trading apps
- Over 8,000 signals for copying
- Economic news for exploring financial markets
You agree to website policy and terms of use
I want to draw the momentum using period_m1 when backtesting with 5 minute choosen as time period.
Problem: Momentum period_m1 is only drawn if I backtest with 1 minute choosen as time period.
Has someone an idea how this could work?
Thanks in advance!