Ubzen System Development Process
ubzen there are basically two approaches to capturing the MAE/MFE of each trade during backtesting.
The first method I pursued was to track the position's max profit/loss tick-by-tick during backtesting, capturing the extremes in "real-time" fashion. This is the most CPU intensive approach and is also the least prone to systematic error in the final result.
The second method, and the one I currently use, is to wait until the backtest is complete and then during the deinit() you loop through the orderhistory, pulling the orderopen and orderclose timestamps for each trade and searching for the extreme low and extreme high price that occurred between those two timestamps. And then use those extreme prices to compute the MAE and MFE that must have occured for the trade at those times.
This is very quick and resource light, ideal for backtesting, but can introduce errors IF the MAE or MFE happens to occur in either the opening candle or the closing candle because the pricepoints that define those candles in the hst file may have happened chronologically prior to orderopen or after orderclose (but within the same candle).
In practice I have not found this drawback to the second approach to actually be much of a concern. But it is something to be aware of.
(another benefit to developing the an include routine for your deinit() is that you can also use it as a script to run on your forward/live accounts...just drag and drop and it enables you to analyze the past trades on the account)
hi ubzen how are you?
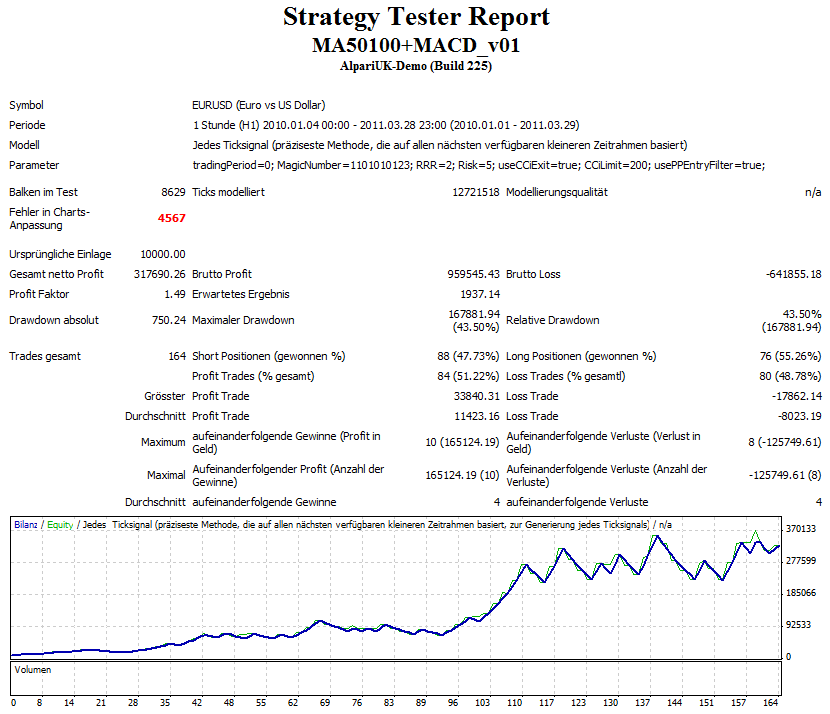
1) Your exit logic seem's not to work as defined in the original system, at least from a first look on the chart.
2) The system works for me better with a risk revard ratio of 2 instead of one, maybe dynamic RRR might even improve more.
3) 01.01.2010 to 01.03.2010 seams to be a sweetspot for this EA, nearly no losses, the period might be a bit small for testing and not good choosen.
4) We have a different interpretation of the strategy, after a price/ma cross i understand that the MACD must have already crossed 0 (but not more than 5 bars away) but you wait for the macd cross and open the orders.
-My interpretation filters already a lot of trades.
I have added:
a)support for for buy's and sell's at the same time. (also if the orders are at breakeven new orders can be opened.)
b)Pivot point entry filter (buy only above/sell only below)
c)i use the CCI instead of the original exit logic. (There is still lot to do regarding this case.)
here some pics:
Thanks Zzuegg,
Man you're such a risk taker ;). 10% ???. I'm glad to see it's working somewhat in the future. I was afraid to look into the future for fear of curve fitting this thing. One visual look is all it'll take.
1) Your exit logic seem's not to work as defined in the original system, at least from a first look on the chart. I'll re-do the code to make sure it's doing the original intend of the provider b4 I post the EA again.
2) The system works for me better with a risk revard ratio of 2 instead of one, maybe dynamic RRR might even improve more. Well, thats why I'm doing all this to see what would improve.
3) 01.01.2010 to 01.03.2010 seams to be a sweetspot for this EA, nearly no losses, the period might be a bit small for testing and not good choosen. So it hit the sweetspot on the first try, I was afraid of that. I really don't care if this thing is the holy grail. I'm just using it as a case study, it's not my system therefore, I can post the codes.
4) We have a different interpretation of the strategy, after a price/ma cross i understand that the MACD must have already crossed 0 (but not more than 5 bars away) but you wait for the macd cross and open the orders. Yeah I taught about that. Only the original provider can clear that up now.
Thanks Zzuegg,
3) 01.01.2010 to 01.03.2010 seams to be a sweetspot for this EA, nearly no losses, the period might be a bit small for testing and not good choosen. So it hit the sweetspot on the first try, I was afraid of that. I really don't care if this thing is the holy grail. I'm just using it as a case study, it's not my system therefore, I can post the codes.
if it works good why not using a system? Still lot to do, but for a raw strategy this show potential. the exit logic has to be extended heavily from my point of view.
regarding the 10% i like to see the up's and down's clearly on testruns, nothing for realistic simulations of course.
add:
the most interesting this ist, that even with a risk revard ratio of 2 this system has won over 50% of the trades which is quite an edge
@1005phillip: Warning Noted. I never toke the time to download tick-data. How big is that problem?
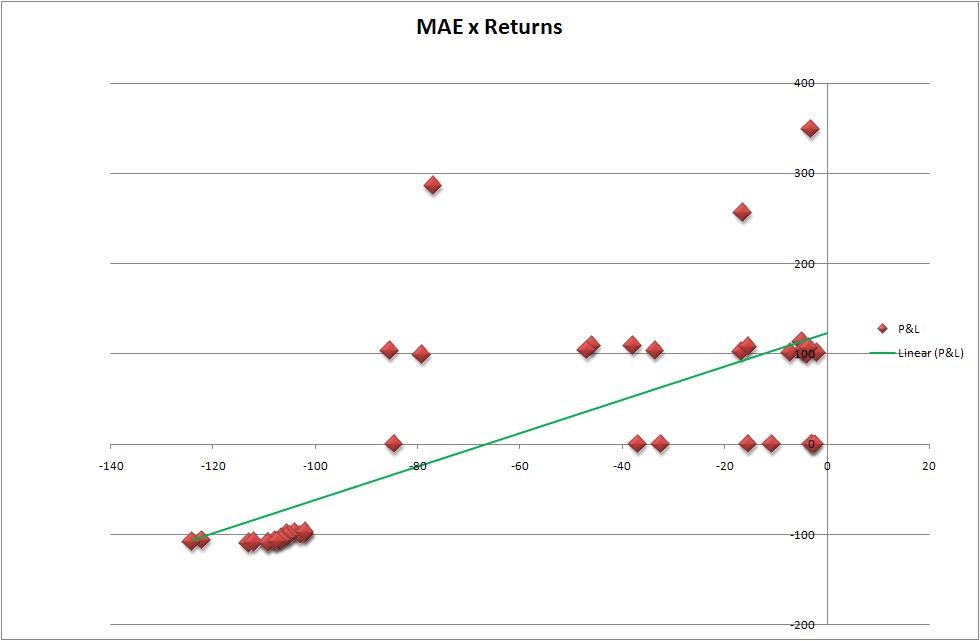
Because the Maximum Adverse Excursion should be more important to a trader we'll start with that. Using the same results, I've plotted what I believe is the (LS method) within my Excel I did trend line, Someone correct me if I'm wrong. The tool used to generate the Spread sheet was Rosh's found here. Next up, I'll use 1005phillip's tool found here to evaluate it based on some different time constants.
Well, it's got a positive slope. So, what does this mean and how can we make it better? Hell, if I knew that, I wouldn't be experimenting here. However, true to the article, it's Positive, thats one point in our piggy bank. I'm going to leave the logic of the Stop_Level in place. When we test it with different time-2-close these numbers should change allot.
Below is the Image of the Plot and Slope.... I've also attached the .csv created by the report.
ubzen, it's a matter of personal preference as to what you do with the MAE data.
I do not characterize MAE versus P/L...to me that is not a statistically valid cause-and-effect.
I characterize MAE as MAE is telling you that your "entry strategy" got you into a position too early, by an amount equal to the MAE. As such your "Profit potential" for the trade was undermined by an amount equal to the MAE.
MAE is for tuning your entry strategy. MFE is for tuning your exit strategy.
The difference between MFE and the OrderProfit is something I call "excess MFE" or simply "EMFE" and this is money that you left on the table by virtue of your exit strategy keeping the position open too long.
And thirdly, time is money. Capital tied up supporting the margin position of a trade is capital that can't be used to support another trade. So the "time to MAE" and "time to EMFE" are parameters to analyze as they are an indication to you of the time you are not using your capital wisely/efficiently.
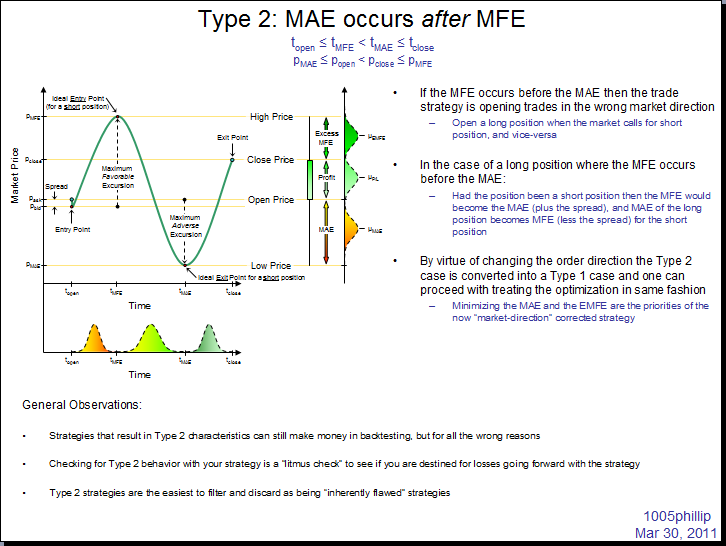
And lastly, it is critical that you investigate the chronology of the occurrence of MAE and MFE. If MAE occurs before MFE then the trade was good but needs optimization to tune the entry and exit strategies for minimal MAE and minimal EMFE.
But if MAE is occurring after MFE then the strategy is busted in multiple ways. Perhaps the most significant being that it is opening positions opposite to that which one should be taking. If your strategy is opens a long position and the market proceeds to carve out a price action that results in the MFE occurring before the MAE for your trade then that means your trade really should have been a short position, not a long position (in which case the MFE for the Long position becomes the MAE for the short, and vice versa for the MFE).
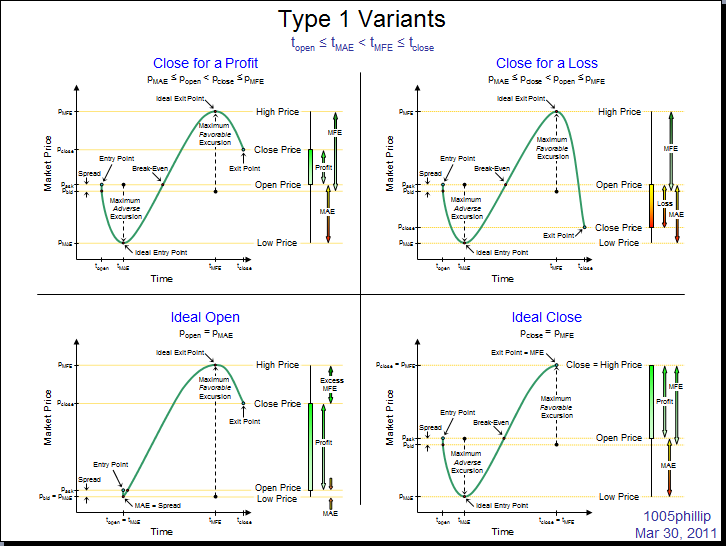
I think I may have posted these up before, can't remember:

hi phillip. just a few small questions from my side:
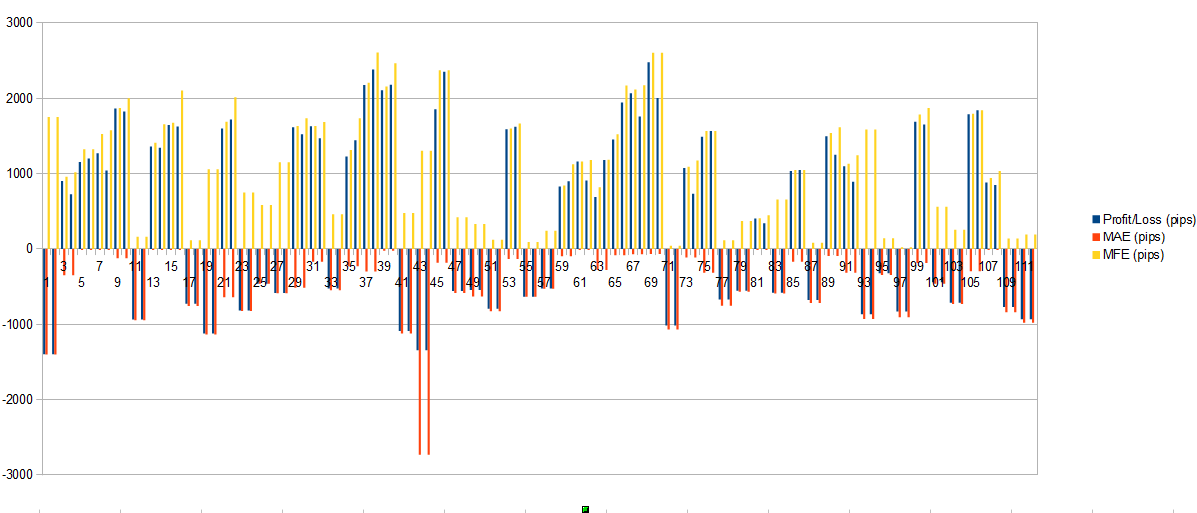
After using your tool i got these histogram files. Up to now i took a close look at the "Profitloss versus MAE & MFE" in pips.
As far i understood these values shows the pips i missed during the trade was open. Basically best results would be when Profit==MFE and MAE==0. Correct?
If you look at the picture below we can see:
- if the EA makes profit, it is close to the MFE (of course since i use takeprofits)
- if the EA makes profit also MAE is mostly near to 0 witch means also the entry's are quite good. (at least the best during the open time of the order)
- if the EA makes losses it mostly matches MAE (of course since stoploss is used):
- If in that case the MFE is near to 0 there was no chance of making profit
- But if the MFE is high is means that i missed an Exit.
Are these conclusions valid?
- Free trading apps
- Over 8,000 signals for copying
- Economic news for exploring financial markets
You agree to website policy and terms of use
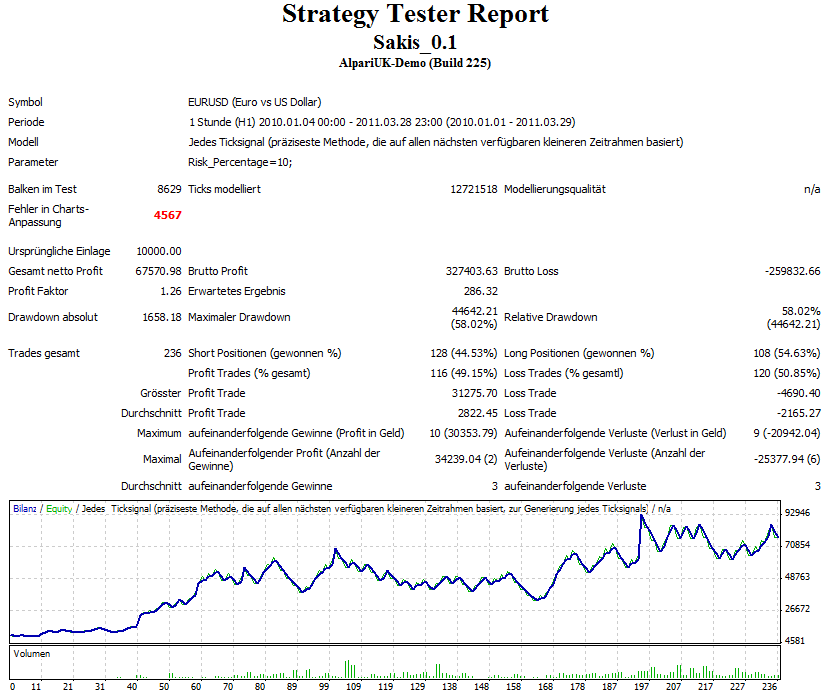
Purpose: I'm trying to define a system development process. I have a few ideas within my head but it's not comprehensive. My hopes is that others who know better could critique the process. If any prominent member have issue with me using the forum like a personal blog, or don't see any good in this experiment, just say so and I'll stop promptly.
Ok, we already have the system provided by a member called sakis here. A small sample of 3-months test showed expectable results. Now I'm learning how to get all the statistical measurement for this period using this article. I'll start with Mae/Mfe first.