Bars in Separate Window??
You are missing trading opportunities:
- Free trading apps
- Over 8,000 signals for copying
- Economic news for exploring financial markets
Registration
Log in
You agree to website policy and terms of use
If you do not have an account, please register
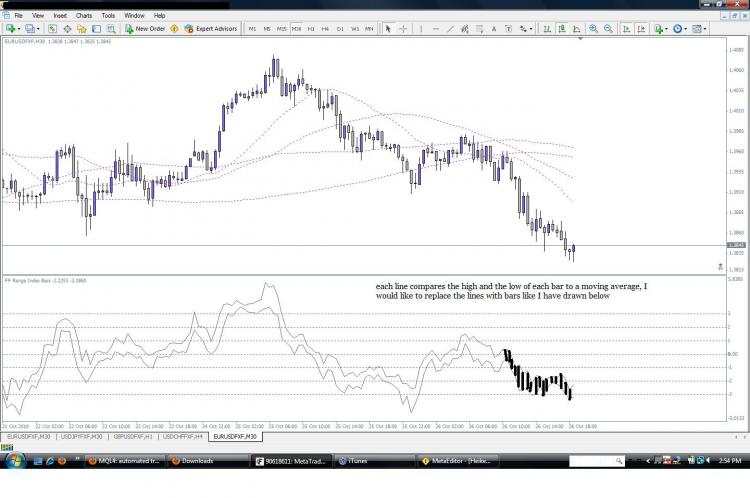
I am trying to draw a bar between two points in a separate window, unlike a histogram that draws a bar from a common point like zero or 100, below is a pic of the indicator, right now i have two lines and i would like a bar to be drawn between each value.
any Ideas?