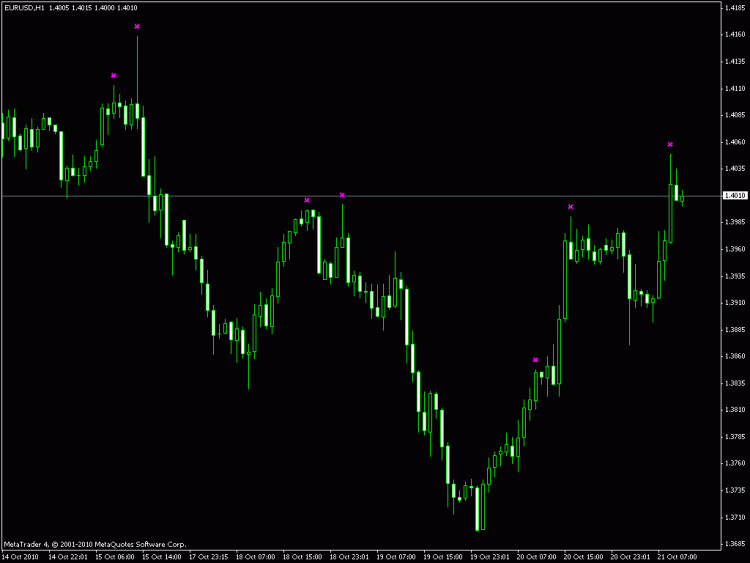
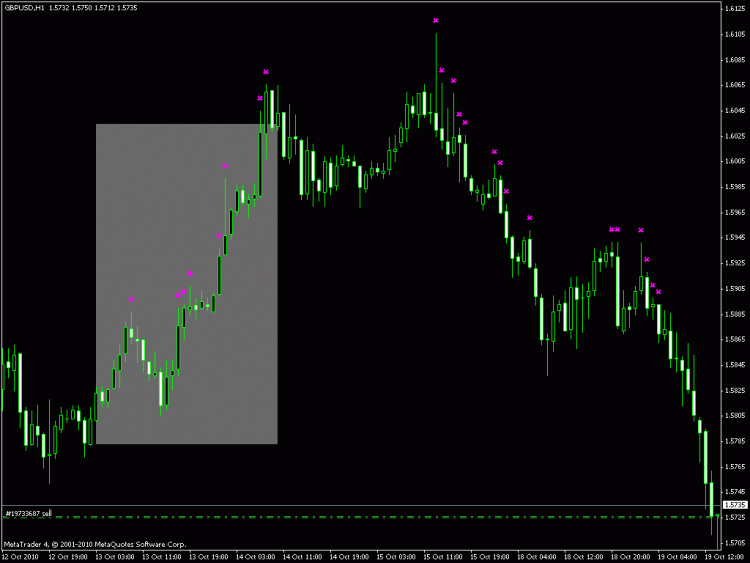
can u explain me something? u want an arrow draw only on the highest 100 bars ?
(Ar galite paaiškinti man ką nors?
Jūs norite atkreipti rodyklę tik kaip didelis baras?
Baras 100)
Yes, qjol, I want to draw arraw only on the highest bar, counting 100 bars from bar in the counting cycle.
Many bars could be marked, but only who are highest. All bars in the right met this criteria.
On left (in rectangle) does not met this criteria, as there are higher bars after them.
try to use ZigZag indicator,and set depth as 100.
try to use ZigZag indicator,and set depth as 100.
Hello,
1. "It should plot arrows at Highest bar, Period 100."
Code: "int bars, HighPer = 30;"
2. Probably we see old arrows.
Best regards
Hello,
Thanks for your attention and help.
I found a solution to my needs, programming my own function and indicator.
I attached it here.
Arrows are plotted, if High is higher than 20 previous highs, and next bar is lower . Arrow name have the highest number.
This indicator simulates Tradestation's PivotStren function.
But my question is still open: is it possible to get this result with iHighest function ?
Edas
//+------------------------------------------------------------------+
//|                                                HighEstPeriod.mq4 |
//+------------------------------------------------------------------+

#property indicator_chart_window
#property link      "analyst.fx-analysis.com"
//#include <Library_calc.mqh>

extern int MaxCalc = 100;
extern int LPivotStren = 20;
extern int RPivotStren = 1;

//+------------------------------------------------------------------+
//| Custom indicator initialization function                         |
//+------------------------------------------------------------------+
int init()
  {
//---- indicators
//----
   return(0);
  }
//+------------------------------------------------------------------+
//| Custom indicator deinitialization function                       |
//+------------------------------------------------------------------+
int deinit()
  {
//----
   for(int i = ObjectsTotal() - 1; i >= 0; i--)
     {
       string label = ObjectName(i);

       if(StringSubstr(label, 0, 4) == "High")
              ObjectDelete(label);

     }
//----
   return(0);
  }
//+------------------------------------------------------------------+
//| Custom indicator iteration function                              |
//+------------------------------------------------------------------+
int start()
  {
   int    Bar, counted_bars=IndicatorCounted();
//----
   if    (counted_bars < 0) return(-1);
   if    (counted_bars>0) counted_bars--;

   int bars, HighBar, HighPer = 100;
   int limit=Bars-counted_bars;

  for (Bar = limit; Bar >= 0; Bar--)  //skaiciuojame nuo ankstesnio baro, iki Mx baru
      {
     // HighBar  = iHighest(NULL,0,MODE_HIGH, HighPer,  Bar)  ;


      int HighPivotNo = HighPivotInt(Bar, MaxCalc, RPivotStren );
      if ( HighPivotNo >= LPivotStren )
         {
         string tekstas = "HighLeftPivot_"+HighPivotNo+"_"+Bar;
         DrawArrow(tekstas, Time[Bar], High[Bar]+15*Point, 251, Magenta, 1);
         }

      }


//----
   return(0);
  }
//+------------------------------------------------------------------+


void DrawArrow(string objectName, datetime Time1, double Price, int ArrowCode, color Color, int Width )
{
   ObjectCreate(objectName, OBJ_ARROW, 0, Time1, Price, 0);
   ObjectSet(objectName, OBJPROP_ARROWCODE, ArrowCode );
   ObjectSet(objectName, OBJPROP_COLOR, Color);
//   ObjectSet(objectName, OBJPROP_RAY, true);
   ObjectSet(objectName, OBJPROP_WIDTH, Width);
   ObjectMove(objectName, 0, Time1, Price);
}

//+------------------------------------------------------------------+

int HighPivotInt(int BarNumber, int MaxBars2Calc, int RStren)
{
int i, PivotStr;

  if (RStren != 0 )
   for (i = 1; i <= RStren; i++)
      if (High[BarNumber] < High[BarNumber-i] )
         return(0);

 if (MaxBars2Calc != 0 )
   for (i = 1; i <= MaxBars2Calc; i++)
      if (High[BarNumber] <= High[BarNumber+i] )
         return(i);

//--------------
return(MaxBars2Calc);
}

int    ali.MaxIndex = iHighest ( 0, 0, MODE_HIGH , 20 , 1 ) ;
int    ali.MinIndex = iLowest  ( 0, 0, MODE_LOW  , 20 , 1 ) ;
double ald.MaxPrice = iHigh    ( 0, 0, ali.MaxIndex ) ;
double ald.MinPrice = iLow     ( 0, 0, ali.MinIndex ) ;
int    ali.MaxTime  = iTime    ( 0, 0, ali.MaxIndex ) ;
int    ali.MinTime  = iTime    ( 0, 0, ali.MinIndex ) ;
- Free trading apps
- Over 8,000 signals for copying
- Economic news for exploring financial markets
You agree to website policy and terms of use

Hello,
Highest function is very easy to understand. However I often got strange results from it.
Below is simple indicator I want to build. It should plot arrows at Highest bar, Period 100. However indicator plots also on bars who does not match this criteria. Why ?
Thanks,
Edas