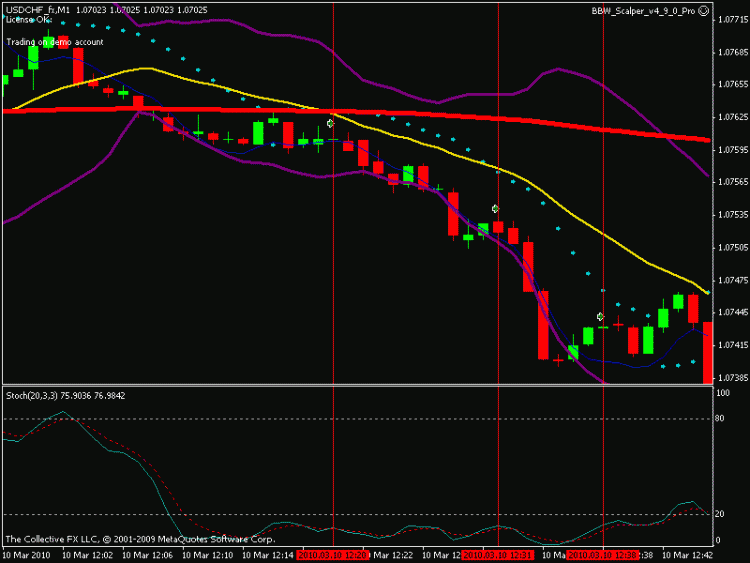
In the image below, I have 3 trades that have read the signal and entered themselves. In a normal bollginger behavior while channeling, these signal would have been considered perfect, however, these are false signals as they are placing buys while the price continues to trend down.
Questions:
1. What or how do I correctly read the ParabolicSARs? Is there code snippet that correctly interprits them?
2. Is there an indicator that I can use that will tell me this is a false signal? What is it and how do I implement it?
Here are the rules to invoke a buy trade:
1. Is Price below 250 EMA?
2. Is candle [3] a down candle, does that candle come within 3 pips of the bottom bollinger line or exceed it?
3. Is candle [2] an up candle with a higher low than candle 3?
4. Is candle [1] an up candle with a higher low than candle 2?
>>1. What or how do I correctly read the ParabolicSARs? Is there code snippet that correctly interprits them?
double mySAR=iSAR(Symbol(),0,0.02.0.2,0); or double mySAR=iSAR(Symbol(),0,0.02.0.2,1); depends from what bar you want to read
LEH
Sorry but IMHO, SAR in Forex is just terrible :(
It is particularly useless at detecting/measuring ranging, which I guess you are after
I would use Envelopes to go with your BolliBands
You will have to experiment with settings, but the idea is that when both Bollis are within the Envelope lines, the market is ranging
With some pairs/timeframes when one Bolli escapes from the Envelopes it is range-over, in others it is when both Bollis escape
You may also find that a conservative MA of some sort can act as an early-closer when a trade goes south,
eg when the 'MA 200 smoothed' crosses the order entry price, its probably time to get out of an M1 range trade... Experiment with settings here as well
Time of day is going to be real crucial for this type of system - have you factored that in - doesnt look like it?!
Also, all of the majors have great breakout potential, which will frequently catch you offside - so maybe try this sort of thing on the crosses, say, EURCAD, CADCHF, GBPCHF, etc
FWIW
-BB-
Oh and I would use simple touch/break of the Bollis as a signal, you seem to be a bit late in with those rules...
-BB-
If SAR value < Low[0] means it's up trend.
- Free trading apps
- Over 8,000 signals for copying
- Economic news for exploring financial markets
You agree to website policy and terms of use
In the image below, I have 3 trades that have read the signal and entered themselves. In a normal bollginger behavior while channeling, these signal would have been considered perfect, however, these are false signals as they are placing buys while the price continues to trend down.

Questions:
1. What or how do I correctly read the ParabolicSARs? Is there code snippet that correctly interprits them?
2. Is there an indicator that I can use that will tell me this is a false signal? What is it and how do I implement it?
Here are the rules to invoke a buy trade:
1. Is Price below 250 EMA?
2. Is candle [3] a down candle, does that candle come within 3 pips of the bottom bollinger line or exceed it?
3. Is candle [2] an up candle with a higher low than candle 3?
4. Is candle [1] an up candle with a higher low than candle 2?