You are missing trading opportunities:
- Free trading apps
- Over 8,000 signals for copying
- Economic news for exploring financial markets
Registration
Log in
You agree to website policy and terms of use
If you do not have an account, please register
So much for “sell in May and go away” — for now at least, there is too much going on.
This week brings testimony by Federal Reserve chair Janet Yellen, an earnings conference call at Pfizer PFE -1.28% that could become an update on its $106 billion bid for AstraZeneca AZN -0.09%, and a possible filing of U.S. papers by Chinese internet giant Alibaba for its gigantic IPO.
Throw in a slew of earnings from companies including Walt Disney DIS +0.94%, Tesla Motors TSLA +1.42%, Whole Foods Market, Groupon, News Corp and Priceline and economic indicators that include an update on the crucial U.S. service industries, and the week ahead looks chock full of potentially market moving news.
Also this week, the U.S. Treasury plans to hold auctions for roughly $69 billion in notes and bonds. Demand for such debt is always closely watched.
Monday brings a 10am earnings conference call by U.S. drug maker Pfizer in New York where it will doubtless face questions from investors on the state of its $106 billion bid for AstraZeneca which was rejected by its British rival on Friday, May 2.
Monday also brings an update on activity in the important U.S. service industries in April, and earnings from American International Group, Vornado Realty, Tenet Healthcare, Occidental Petroleum and Anadarko Petroleum.
Tuesday brings an update on the U.S. trade deficit and earnings from a large number of companies including Walt Disney, Whole Foods Market, Groupon, UBS, Barclays, Liberty Global, Adidas and Fiat.
Tuesday also sees the annual meeting at Sotheby’s in New York which could provide fireworks as activist investor Dan Loeb agitates for change at the company.
Wednesday sees Federal Reserve chair Janet Yellen testify to the Joint Economic Committee of Congress on the outlook for the U.S. economy, with investors anxious to hear any hints on when the Fed will eventually allow interest rates to rise back toward normal levels after helping to keep them near zero for five years.
Wednesday will also provide an update on U.S. consumer credit, and earnings from a huge list of companies that will include Tesla Motors, Moelis & Co, Chesapeake Energy, Duke Energy, Hertz Global, Anheuser-Busch InBev, Alstom, Hugo Boss, ING, Siemens, Imperial Tobacco Group, Nintendo and HSBC Holdings.
Thursday is a big day for central bankers, with Fed chair Janet Yellen testifying this time before the Senate Budget Committee, Fed governor Daniel Tarullo addressing a Chicago Fed conference, and interest rate decisions from the European Central Bank and the Bank of England.
Thursday also brings closely-watched April trade data from China and earnings from Priceline.com, Toyota Motor, Wendy’s, News Corp and CBS.
Friday provides an update on U.S. wholesale inventories, China’s consumer price index and earnings from ArcelorMittal, Petrobas, Suzuki Motor and Ralph Lauren.
All through the week, though, investors will be watching for any news on Alibaba filing papers for its planned U.S. IPO, which could be among the biggest initial public offerings of stock in history.
NFP Forex Fuel Fizzles Out
Expect a relatively quiet forex session with London offline on Monday as global investors digest a mixed bag of news ranging from weak Chinese manufacturing data to unsettling signs of an escalating conflict in Ukraine.
Strong nonfarm payrolls (NFP) data did indeed surprise last Friday, completing a week of whipsaw data that also featured a softer-than-expected U.S. gross domestic product (GDP) report. However, the bigger surprise was the dollar weakening during a choppy trading session last Friday, in turn crushing many expectations. In the end, the strong unemployment headline was not enough to change the tune that capital markets have been playing for some time. If anything, it confirms that the weather-related bounce back is happening. The key to the buck’s weakness lies with the Federal Reserve but it’s going to take some time to gauge the underlying performance of the economy. That provides Fed Chair Janet Yellen and company breathing room and with wage inflation so tame, there is no reason for the Fed to change its “lower for longer” message. However, with Q3 (the third installment of quantitative easing) on the table, the dollar has problems.
The boost to market sentiment provided by NFP data did not last long. Global equities start the week on the back foot, as investors digest the latest sign of weakness from China’s manufacturing sector. Investors are also keeping an eye on the spreading conflict in Ukraine. With London on a public holiday, trading will be somewhat subdued. Nonetheless, a disappointing Chinese HSBC manufacturing purchasing managers’ index for April is not helping (48.1 versus 48.3). This morning’s print continues to defy the steadying trend in official stats; however, not all is bad news. Despite the final headline being downgraded, there were signs of stabilization in total orders and production, with both indexes rising month-over-month for the first time in 12 months. This tidbit of positivity would suggest that Beijing’s mini-support measures are helping to prevent a steeper downturn in Chinese GDP.
Treasurys Climb
The accumulations of various geopolitical concerns and economic disappointments have safe-haven assets again in demand. Bunds and U.S. Treasurys, which dipped briefly following the NFP report but quickly recovered, have managed to inch higher this Monday as the market heads stateside. Even the yen is trading sub-¥102, while commodities — especially gold — has found some of its long lost support striding toward $1,315 in the late European session.
Similar to the U.S. yield curve, the two- and 10-year German Bund spread is just holding above its +131bps low. The curve is certainly flatter after last week’s high print of +135bps. The market expects stop losses to be an issue on a break of this lower level. However, there is an outside chance of a full return to the +115bps low from 12 months ago. The difficulty, as with its transatlantic counterparty, has to do with demand. U.S. Treasurys and German Bunds require a fresh bout of bullish sentiment, which is difficult at such low yields – the 10-year Bund is currently straddling +1.45% and eyeing +1.40%, while its U.S. counterpart is trading at +2.58%.
From a currency perspective, it’s a similar situation. There are no surprises with the EUR again trading steady early Monday morning though for many, technical analysis data indicates a strong likelihood the 18-member single currency will rally versus the greenback this week. The EUR is supposed to be firmly supported by the Bollinger upward channels on both the daily and weekly charts – at €1.3685 and €1.3861, respectively. This would suggest to any EUR bull that buying the single currency on dips is the way forward in the short term. However, through these support levels expect many ‘long’ positions to begin seeking an exit. The EUR uptrend should continue to guide the bulls toward that psychological €1.4000 channel — a level where the European Central Bank is expected by many to become more “vocal.” For the time being, the trend remains your friend.
Other highlights this week will be the Aussie rate decision on Tuesday, where no change is expected. The Reserve Bank of Australia is expected to closely monitor the jobs numbers Down Under among signs that the economy there is picking up. On Wednesday, Yellen testifies before the Congress Joint Economic Committee on monetary policy and the U.S. economic outlook. After avoiding a press conference at last week’s Federal Open Market Committee meeting, and mostly skipping monetary policy themes in a speech on Thursday, the Fed’s head may be forced to clarify her thoughts on the economy. The market will be looking for anything in reference to last week’s supposedly strong jobs report.
2014-05-06 01:30 GMT (or 03:30 MQ MT5 time) | [AUD - Trade Balance]
if actual > forecast = good for currency (for AUD in our case)
==========
Australia March Trade Surplus A$731 Million
Australia posted a seasonally adjusted merchandise trade surplus of A$731 million in March, the Australian Bureau of Statistics said on Tuesday - down A$526 million or 42 percent on month.
The headline figure was well shy of forecasts for a surplus of A$1.2 billion and down from the surplus of A$1.257 billion in February.
Exports were down 2.0 percent on month in March to A$29.033 billion
Non-rural goods dipped A$578 million (3 percent) and non-monetary gold shed A$56 million (4 percent).
Rural goods added A$47 million (1 percent) and net exports of goods under merchanting spiked A$1 million (7 percent). Services credits gained A$40 million (1 percent).
Imports were roughly flat on month at A$28.302 billion, easing A$21 million from the previous month.
Capital goods shed A$119 million (2 percent), while consumption goods lost A$48 million (1 percent) and non-monetary gold tumbled A$41 million (12 percent).
Intermediate and other merchandise goods added A$224 million (2 percent). Services debits lost A$36 million (1 percent).
Upon the release of the data, the Australian dollar eased from early highs against other major currencies, trading at 0.9279 against the greenback, 94.77 against the yen, 1.4951 against the euro and 1.0677 against the kiwi.
2014-05-06 04:30 GMT (or 06:30 MQ MT5 time) | [AUD - Cash Rate]
if actual > forecast = good for currency (for AUD in our case)
==========
Australia Keeps Rates Unchanged At 2.50%
The Reserve Bank of Australia on Tuesday left its key interest rate unchanged as widely expected by economists.
The monetary board governed by Glenn Stevens decided to maintain the cash rate at 2.50 percent. The board assessed that monetary policy is appropriately configured to foster sustainable growth in demand and inflation outcomes consistent with the target.
On present indications, the most prudent course is likely to be a period of stability in interest rates, the central bank said in a statement.
Looking ahead, members said continued accommodative monetary policy should provide support to demand, and help growth to strengthen over time. Further, inflation is expected to be consistent with the 2-3 percent target over the next two years.
2014-05-06 07:15 GMT (or 09:15 MQ MT5 time) | [EUR - Spanish Services PMI]
if actual > forecast = good for currency (for EUR in our case)
==========
RBA Holds Rates Steady at 2.5%, AUDUSD Little-Changed
The Reserve Bank of Australia (RBA) kept its headline rate unchanged at 2.50 percent, and the policy statement accompanying the interest rate decision exuded a broadly upbeat tone.
“At the December and February meetings, the Board judged that, given the substantial degree of policy stimulus that had been imparted and evidence of its effects, it was prudent to hold the cash rate steady,” said the RBA in its monetary policy statement released earlier today, “market pricing suggests no change to the cash rate is expected for about a year.”
The RBA says the risks surrounding the forecasts for the global economy appear broadly balanced, and amidst China’s economic slowdown growth forecast remains broadly in-line.
“Over the past few months, there have been further signs that very stimulatory monetary policy is working to support economic activity,” said the RBA, “nevertheless, it is likely that the unemployment rate will continue to edge higher for a few quarters, and turn down only after growth rises to an above-trend pace.” Inflation is expected to remain consistent with the target.
Forum on trading, automated trading systems and testing trading strategies
AUDUSD Technical Analysis 2014, 04.05 - 11.05: Flat or Ranging?
newdigital, 2014.05.06 07:48
AUDUSD M5 : 35 pips price range movement by AUD - Cash Rate news event
Growth Versus Value With Markets At A Crossroads
Fund managers have different strategies for navigating the ebbs and flows of investing. For Value style investors, it all boils down to one main rule; “buy low, sell high.” The phrase is often quoted, but often abandoned by Growth style investors in favor of another notable phrase: “buy high, sell higher.” While both styles can deliver gains, sometimes investors get swept up with the short term trends and forget the big picture. Over long periods of time, investments tend to reflect the characteristics of each asset class. Over short periods of time, the picture can be skewed or distorted by many factors, including market swings, investor sentiment, government intervention, recessions, wars, etc. Within these swings lies pitfalls and opportunity.


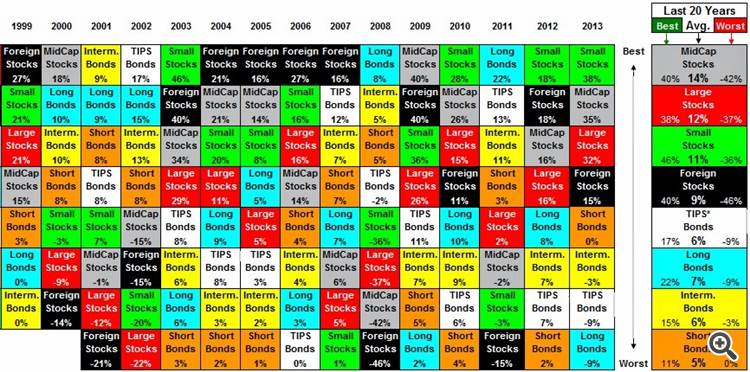
The following graph shows the year to year swings of various asset classes along with the 20 year long term average of each asset class (on the right). The long term averages reveal the range of the investment returns, along with the average of that range. Where the market lies within the range has a very dramatic impact on the experience you have as an investor.
Another rule of investing is called “gravitation to the mean” which means that all investments will eventually gravitate back to the characteristic average, often referred to as the “fundamentals” of that investment. The problem with this rule is that there are no market signals to tell you when the timing of this “mean reversion” will happen. This brings up a corollary to this rule, “the market can be irrational longer than you can be solvent.” This is the rule that drove hedge fund manager Julian Robertson out of business in 2000, four months before he would have been proven right.
This was never truer than the high tech boom of the late 1990s. Irrational exuberance over tech stocks sent valuations exponentially higher than their fundamentals warranted. The trend lasted for years before crashing back to earth. The NASDAQ still has not recovered. For the following few years, the trend reversed and the low tech stocks rallied. The previous graph shows four years of international stock outperformance in a row from 2004 to 2007. This momentum continued for four years before going to the bottom of the barrel in 2008.
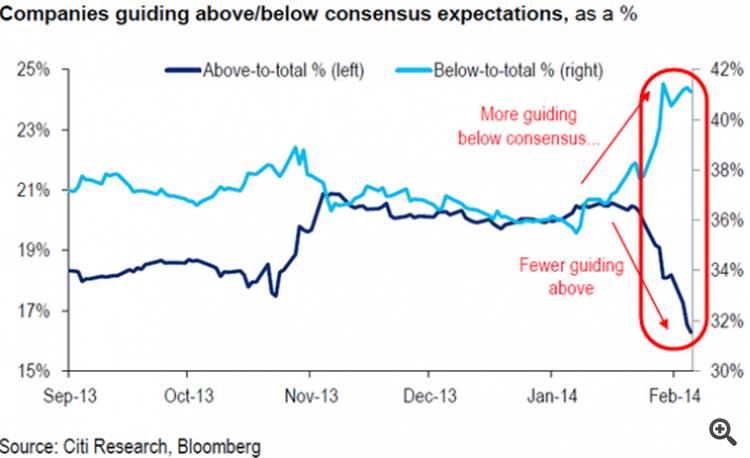
To get a vision of where an investment category is in the cycle, one can look at the fundamentals of the category. Although dividends are the most visible form of income to the investor, we can go one step further to view the driver of dividends: earnings. Earnings are used as a signal of value in growing companies that do not yet pay a dividend, and earnings are strongly correlated to dividends in dividend paying companies. Based on these fundamentals, the price that one pays for the value of a stock in terms of its earnings can be expressed as a ratio, the P/E ratio. At the time of that KnowRisk commentary, the forward P/E ratio of the equity market was 12 with earnings rising. Since the third quarter of 2012 to present day, the Dow Jones Dividend index is up over 35% to a PE ratio of 17. To get a sense of what lies ahead for US stocks, we can look at future expectations for earnings. As you can see from the below chart, guidance is proving to be less optimistic. The domestic market has all the momentum from 2013 but may need to take a breather which is what has been happening so far in 2014.
With equity markets taking a bit of breather our first look is to bonds. Bonds with exposure to U.S. interest rate risk do not have a rosy future for the next few years in this flat to rising interest rate environment. The latest estimates from the Federal Open Market Committee continue to show rate increases beginning in late 2015 and accelerating into the long run. What options, then, are left to the intelligent investor?
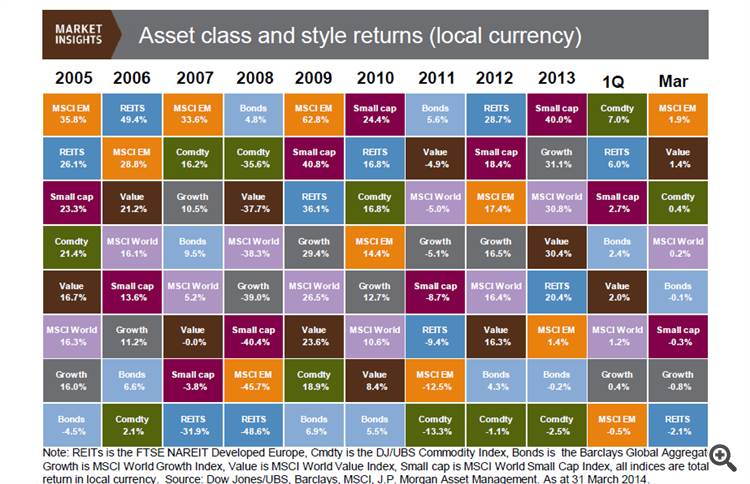
A more diversified chart including international stock, commodities, REITs, and splitting stock into the Growth and Value components, produces a graph that looks like the one below. Note that the growth and value styles are both successful, but can have wide performance differentials like the 10 point spreads in 2006 and 2007. Without steady growth and momentum producing a category consistently at the top for the last market cycle we find ourselves in a much different market position than in the 2004 to 2007 run of Foreign Stocks.
With the understanding that market cycles and long term trends shift we would perhaps be best served by looking for value in the investment categories that are at the bottom of return charts. The risk of owing them is often lower the longer they have been the worst performers and historical mean reversion should mean they are perhaps due for a period of stronger returns.
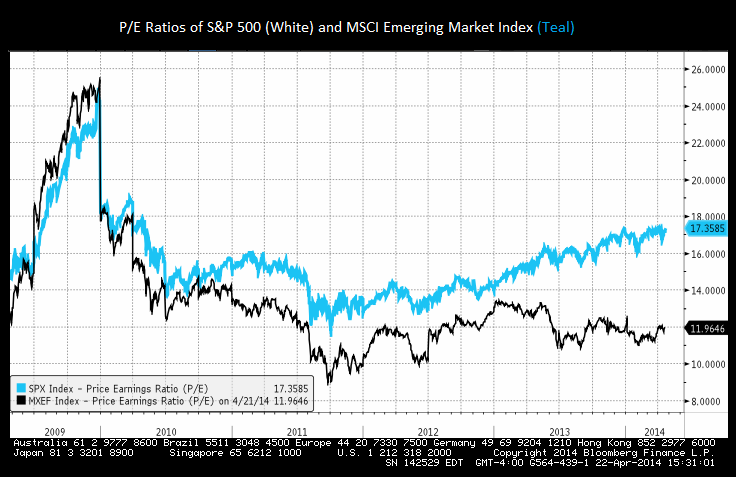
In particular commodities and emerging markets seem to be undervalued. A glance at the Price/Earnings ratios of domestic stocks vs. the emerging market stocks [below] reveals a differential of 17 vs 12 suggesting that after the big run up in US stocks, the EM companies can be bought cheaper than domestic. The spread in valuations between the two indexes is larger than it has been at any time in the past five years. The “buy low, sell high” investor, will look to these underperforming assets which can be purchased at a better price.
A look at commodities in the previous asset class chart shows that they have produced the best returns during the first qauarter of 2014. This is after being the worst performing asset class for the three previous years. Perhaps it is the beginning of a period of mean reverting outperformance for commodities? Perhaps it a short term positive move in a longer term bear market for the category? Only time will tell, but history has shown that eventually the categories at the bottom of the return charts will rotate to the top. The question for investors is where it makes more sense to buy these categories. At the bottom when they are cheap, or at the top when they have momentum?
Looking into the future will always be an inexact science. It is hard enough to look into the present and understand what you see. As Yankee great Yogi Berra said: “Predictions are hard to make, especially about the future.”
2014-05-07 01:30 GMT (or 03:30 MQ MT5 time) | [AUD - Retail Sales]
if actual > forecast = good for currency (for AUD in our case)
==========
Australia Retail Sales Gain 0.1% In March
Total retail sales in Australia added a seasonally adjusted 0.1 percent on month in March, the Australian Bureau of Statistics said on Wednesday - coming in at A$23.149 billion.
That was shy of forecasts for a gain of 0.4 percent following the upwardly revised gain of 0.3 percent in February (originally 0.2 percent) and the 1.1 percent spike in January.
By individual component, food retailing was up 0.5 percent, while household goods retailing added 1.1 percent, cafes, restaurants and takeaway food services gained 1.0 percent and other retailing was up 0.2 percent.
Sales at department stores fell 0.6 percent, while clothing, footwear and personal accessory retailing eased 0.2 percent.
By region, sales were up 0.9 percent in New South Wales, along with Victoria (0.5 percent), Queensland (0.4 percent), Tasmania (0.6 percent) and the Northern Territory (0.4 percent).
South Australia and Western Australia were relatively unchanged, while sales in the Australian Capital Territory fell 0.5 percent.
For the first quarter of 2014, retail sales climbed 1.2 percent on quarter to A$67.519 billion - in line with expectations, but missing forecasts for 1.6 percent after gaining 1.1 percent in the three months prior.
Upon the release of the data, the Australian dollar dropped against other major currencies, trading near 0.9340 against the greenback, 94.88 against the yen, 1.4918 against the euro and 1.0733 against the kiwi.
2014-05-07 14:00 GMT (or 16:00 MQ MT5 time) | [USD - Fed Chair Yellen Speech]
==========
Yellen: Economy Improving But Rates To Remain Low
Slack in the labor market and low inflation will keep interest rates near zero even as the broader economy gradually improves, Federal Reserve Chair Janet Yellen told Congress Wednesday morning.
In remarks prepared for her semi-annual testimony before the Joint Economic Committee, Yellen expressed concerns about slow wage growth, high levels of long-term unemployment and those people working part-time who want full-time work.
The U.S. economy is picking up after a winter lull brought on by unusually bad weather across much of the country, but the labor market is "far from satisfactory" despite the unemployment rate falling to 6.3 percent in April.
"With the harsh winter behind us, many recent indicators suggest that a rebound in spending and production is already under way, putting the overall economy on track for solid growth in the current quarter," Yellen said.
She expects growth will expand at a "somewhat faster pace" this year than the 1.9 percent growth rate seen in 2013.
However, inflation is likely to run below the Fed's 2 percent target, so a high degree of monetary accommodation remains warranted for the foreseeable future, according to Yellen.
The recent housing market slowdown "could prove more protracted than currently expected," and could prevent a more robust recovery from a weak first quarter that saw the economy grow only 0.1 percent.
"Adverse developments abroad, such as geopolitical tensions or an intensification of financial stresses in emerging market economies" also pose a risk to the economic outlook.
AUDUSD Technical Analysis (based on dailyfx article)
he greenback advanced against all four components, led by a 0.14 percent drop in the Australian dollar, and the AUD/USD may face a larger decline over the near-term as the bearish RSI momentum takes shape. However, another 8.8K rise in Australia Employment may prop up the higher-yielding currency as it raises the growth outlook for the $1T economy, and the AUD/USD may trade on a firmer footing in the second-half of the year as the positive developments coming out of the region boosts interest rate expectations.
Nevertheless, the Reserve Bank of Australia (RBA) may come under increased pressure to weaken the local currency as it undermines the central bank’s upbeat assessment for 2014, and Governor Glenn Stevens may have little choice but to act against the Australian dollar as market participants no longer react to the verbal intervention.
With that said, wewill closely monitor the RSI as the oscillator highlights a lower high in the exchange rate, but we need a break and a close below the 0.9200 handle to adopt a more bearish forecast for the AUD/USD as it continues to hold up as near-term support.