Press review - page 558
You are missing trading opportunities:
- Free trading apps
- Over 8,000 signals for copying
- Economic news for exploring financial markets
Registration
Log in
You agree to website policy and terms of use
If you do not have an account, please register
General Electric’s stock price - weekly bearish breakdown; daily rally to the bullsh reversal (based on the article)
The price on the weekly chart is on bearish breakdown: price broke Ichimoku cloud to below for the reversal from the primary bullish to the primaru bearish market condition.
By the way, the daily price is on the secondary rally to be started with nearly to be reversed to the bullosh so if this tendency will remain - we may see the global bullish reversal for this stock price for example.
-----------
Chart was made on MT5 with BrainTrading system (MT5) from this thread (free to download) as well as the following indicators from CodeBase:
All about BrainTrading system for MT5:
Weekly Outlook: 2017, September 24 - October 01 (based on the article)
The US dollar rallied on the Fed decision but its strength faded away. What’s next? The German elections, durable goods orders, and several GDP publications stand out as Q3 draws to a close. Here are the highlights for the upcoming week.
Weekly EUR/USD Outlook: 2017, September 24 - October 01 (based on the article)
EUR/USD dropped to lower ground, but gradually recovered, holding onto known ranges. The German elections provide a strong start to the week, which continues with inflation figures and other data. Here is an outlook for the highlights of this week.
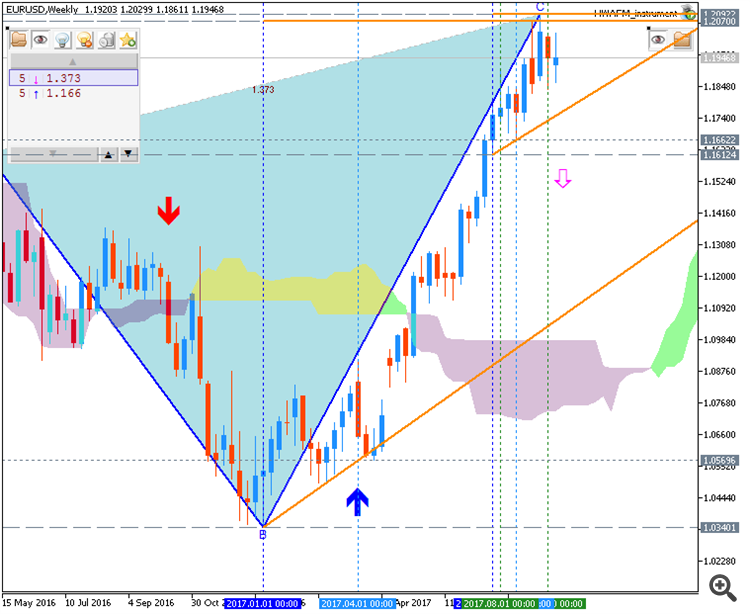
EUR/USD - bullish ranging near intra-day bearish ranging reversal (based on the article)
Intra-day H4 price is above 200 SMA and near above 100 SMA in the primary bullish area of the chart. The price is testing 1.1935 support level to below for the ranging market condition with 1.1890 bearish reversal level as a nearest taregt in this case.
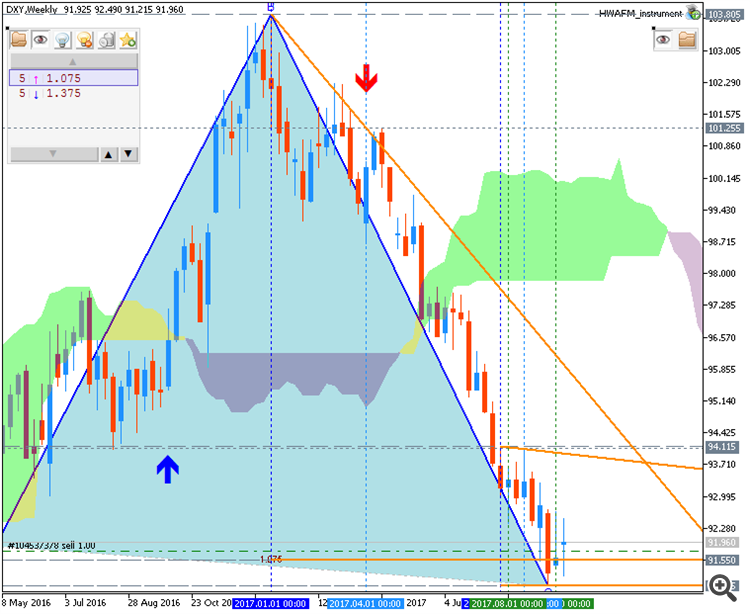
Weekly Fundamental Forecast for Dollar Index (based on the article)
Dollar Index - "The US Dollar was spared a fifth consecutive week of losses, with the Fed monetary policy announcement helping prices to rebound from a 15-month low. Chair Janet Yellen and company stood by near- to medium-term rate hike projections despite disinflation in the first half of the year, which markets saw as comparatively hawkish (as expected). They also announced the start of “quantitative tightening” (QT). The Eurozone’s monetary authority will decide on the fate of its QE asset purchases next month, with many market participants seemingly primed for a cutback. Meanwhile, the BOC has launched its own rate hike cycle recently and the BOE has signaled it is preparing to follow suit in the near term. Bargain-hunting in the early stages of tightening outside the US may prove too compelling to pass up for investors."
-----------
Chart was made on MT4 using iFibonacci indicator and MaksiGen_Range_Move indicator from CodeBase (free to download).
Weekly Fundamental Forecast for GBP/USD (based on the article)
GBP/USD - "While political uncertainty and sluggish economic growth might argue for a weaker British Pound, it seems unlikely to lose much of the gain made so far this year against the US Dollar, largely because there is a clear risk that the Bank of England will tighten monetary policy at the November 2 meeting of its rate-setting monetary policy committee."
-----------
Chart was made on MT4 using iFibonacci indicator and MaksiGen_Range_Move indicator from CodeBase (free to download).
Weekly Fundamental Forecast for AUD/USD (based on the article)
AUD/USD - "All that probably means is that the “USD” side of AUD/USD will continue to drive. There are plenty of heavyweight US economic releases on the sked, including a second look at second-quarter Gross Domestic Product. We’ll also hear from Fed Chair Janet Yellen again. She’s down to speak on Tuesday. While the pair may very well move on any of the above, it’s tough to spot anything likely to break the current, well-entrenched trading pattern. So, yet another neutral call it has to be."
-----------
Chart was made on MT4 using iFibonacci indicator and MaksiGen_Range_Move indicator from CodeBase (free to download).
Weekly Fundamental Forecast for USD/JPY (based on the article)
USD/JPY - "The big item on next week’s calendar out of Japan is inflation for the month of August, set to be released on Thursday evening (Friday morning in Europe and Japan). Given that we’ve just gotten a fresh dose of dovishness from the BoJ, this would likely need to be shockingly-high to directly elicit Yen strength, as the .4% inflation that we’ve seen for the past four months is well-below the BoJ’s 2% target and keeps the BoJ in a position to remain as one of the more dovish global Central Banks."
-----------
Chart was made on MT4 using iFibonacci indicator and MaksiGen_Range_Move indicator from CodeBase (free to download).
Weekly Fundamental Forecast for NZD/USD (based on the article)
NZD/USD - "The New Zealand dollar remains bid ahead of the election as opinion polls show Prime Minister Bill English as the favored candidate, but fresh remarks from the Reserve Bank of New Zealand (RBNZ) may sway the near-term outlook for NZD/USD as the central bank appears to be on course to preserve the record-low cash rate throughout 2017. Despite the change in leadership, Deputy Governor Grant Spencer may strike a similar tone as his predecessor, Graeme Wheeler, as ‘numerous uncertainties remain and policy may need to adjust accordingly.’ As a result, the, the RBNZ is widely expected to retain the current policy at the September 28 meeting and the central bank may merely attempt to buy more time as ‘GDP in the March quarter was lower than expected, adding to the softening in growth observed at the end of 2016.’ It seems as though the RBNZ will continue to lag behind its U.S. counterpart as the Federal Open Market Committee (FOMC) shows a greater willingness to implement another rate-hike in 2017, and the kiwi-dollar exchange rate may exhibit a bearish behavior going into the end of the month should Deputy Governor Spencer and Co. tame expectations for higher borrowing-costs."
-----------
Chart was made on MT4 using iFibonacci indicator and MaksiGen_Range_Move indicator from CodeBase (free to download).
Weekly Fundamental Forecast for S&P 500 (based on the article)
S&P 500 - "The S&P is still looking to hold onto the prior record highs from August, with the 2491 level on watch. As we noted earlier in the week, the trend and recent breakout favors higher prices, but a rally could quickly be capped by one of a pair of top-side trend-lines. One extends back to March and clocks in close to 2520, while the other crosses over highs since June and registers in the vicinity of 2430/35. They are moving targets given the upward slope. A strong undercut of 2491 would be reason to be cautious."
-----------
Chart was made on MT4 using iFibonacci indicator and MaksiGen_Range_Move indicator from CodeBase (free to download).