GBPUSD Technical Analysis 02.06 - 09.06 : Trying to Reverse to Bullish
My personal opinion is that the price will keep ranging following the red down trend line, for the week that is coming.

My personal opinion is that the price will keep ranging following the red down trend line, for the week that is coming.
Yes, this is my opinion too - the price may иу continuing this rally to break 1.5237 resistance but it will not break 1.5276 and will continuing bearish with ranging:
MetaTrader Trading Platform Screenshots
MetaQuotes Software Corp., MetaTrader 5, Demo
bearish with ranging

Yes, this is my opinion too - the price may иу continuing this rally to break 1.5237 resistance but it will not break 1.5276 and will continuing bearish with ranging:
For your chart it's easy to see why you mention 1.5237 as resistance since it's the last daily highest,
but it's not clear how did you come to the second resistance 1.5276.
Please share if it's from your indicator (which I don't know how it works) or other.
This is the indicator from CodeBase coded by my friend: MaksiGen_Range_Move MTF and so on - I am making this technical analysis using free indicators only.
Template and the explanation about this indicator is on this post. By the way - this indicator is part of old good manual trading system: MaksiGen system (or Paramon system). I will create separated threads about this good system.
Because I started this big thread Market Condition Evaluation based on standard indicators in Metatrader 5 but it is 48 pages sorry ... but if you will read there so you will find MT5 indicators and MT5 EAs there.
Thanks!
This is an interesting indicator, I will test it.
This is breakout for GBPUSD H1
MetaTrader Trading Platform Screenshots
MetaQuotes Software Corp., MetaTrader 5, Demo
gbpusd h1 breakout

We are having the following news event right now:
2013-06-03 08:30 GMT | [GBP -Manufacturing Purchasing Managers Index (PMI)]
How "to read" this news event?
- result above 50 is bullish for the GBP, and result below 50 is bearish.
- actual > forecast data is good for GBP
Previous data was 50.2; forecast was 50.2 too and actual data is 51.3
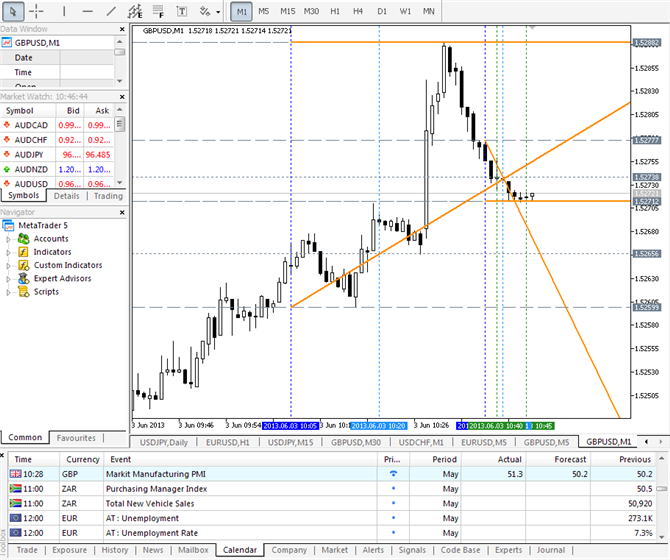
Why do we see downtrend for GBPUSD for now on M1 timeframe (this is the best timeframe to follow news events)? because price was already played on this events at 08:28, and it is 'the using correction after news event' is going for now.
But if we are talking about D1 timeframe so it is nothing really happened about:

- Free trading apps
- Over 8,000 signals for copying
- Economic news for exploring financial markets
You agree to website policy and terms of use
The price was on bear market rally for the last week trying to break few resistance lines and came very close to Sinkou Span B (one of the border of Ichimoku cloud). By the way - Ichimoku cloud is thin and it's already turned to bullish by color. But Tenkan abd Kijun lines are not indicating this bullish reversal, abd the price will will have 1.5237 and 1.5276 resistance levels on the way to this bullish reversal.
If the price will finally break 1.5237 and 1.5276 levels so we may have good uptrend with ranging market condition. If the price will not break those resistance lines - the bearish trend will be continuing with ranging market condition as well.
UPCOMING EVENTS (high/medium impacted news events which may be affected on GBPUSD price movement for the next week)
2013-06-03 08:30 GMT | [GBP -Manufacturing Purchasing Managers Index (PMI)]
2013-06-03 14:00 GMT | [USD -ISM Manufacturing PMI]
2013-06-04 08:30 GMT | [GBP -Construction PMI]
2013-06-04 12:30 GMT | [USD -Trade Balance]
2013-06-05 08:30 GMT | [GBP -Service PMI]
2013-06-05 09:00 GMT | [EUR -Gross Domestic Product (GDP)]
2013-06-05 12:15 GMT | [USD -ADP Employment Change]
2013-06-05 14:00 GMT | [USD -ISM Non-Manufacturing PMI]
2013-06-06 11:00 GMT | [GBP -BoE Interest Rate]
2013-06-07 08:30 GMT | [GBP -Trade Balance]
2013-06-07 08:30 GMT | [USD -Non-farm Payrolls]
SUMMARY : ranging
TREND : bear market rally
Intraday Chart