Nobody knows ?
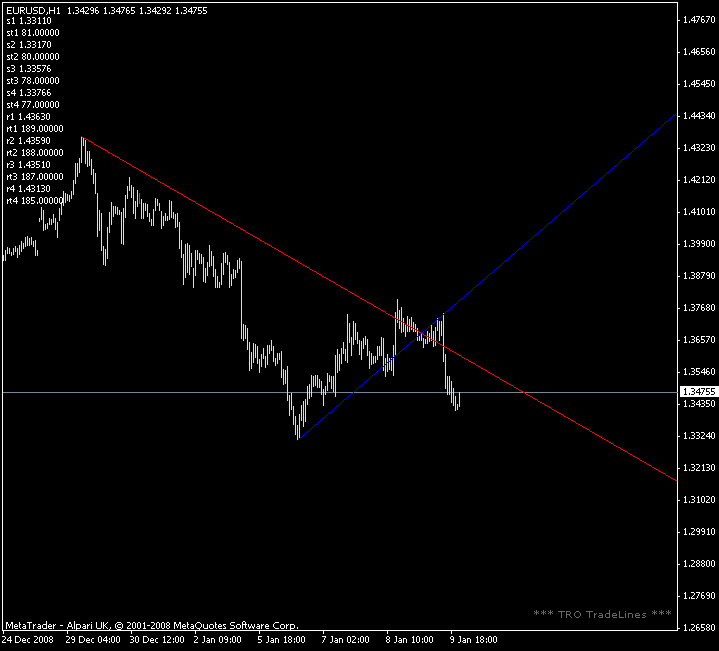
I would like to draw automatically on 30 MIN chart two lines (support and resistance) indicated by the last 300 bars. From the last 300 bars indicator should find two MAXIMUM BARS (ONLY 2 HIGHEST BARS AMONG THE LAST 300 BARS) and draw the RED LINE and from the other hand the same indicator should find two MINIMUM BARS (ONLY 2 LOWEST BARS AMONG THE LAST 300 BARS) and draw the GREEN LINE as on the picture.
I wrote an indicator that does EXACTLY what you asked for
//+------------------------------------------------------------------+
//|   TRO_TrendLine                                                  |
//|                                                                  |
//|   Copyright © 2009, Avery T. Horton, Jr. aka TheRumpledOne       |
//|                                                                  |
//|   PO BOX 43575, TUCSON, AZ 85733                                 |
//|                                                                  |
//|   GIFTS AND DONATIONS ACCEPTED                                   |
//|   All my indicators should be considered donationware. That is   |
//|   you are free to use them for your personal use, and are        |
//|   under no obligation to pay for them. However, if you do find   |
//|   this or any of my other indicators help you with your trading  |
//|   then any Gift or Donation as a show of appreciation is         |
//|   gratefully accepted.                                           |
//|                                                                  |
//|   Gifts or Donations also keep me motivated in producing more    |
//|   great free indicators. :-)                                     |
//|                                                                  |
//|   PayPal - THERUMPLEDONE@GMAIL.COM                               |
//+------------------------------------------------------------------+
//| Use http://therumpledone.mbtrading.com/fx/ as your forex broker  |
//| ...tell them therumpledone sent you!                             |
//+------------------------------------------------------------------+
#property  copyright "Copyright © 2009, Avery T. Horton, Jr. aka TRO"
#property  link      "http://www.therumpledone.com/"

#property indicator_chart_window

extern int myBars = 300;

extern color ColorTrendUp    = Red ;
extern color ColorTrendDn    = Blue ;

int cnt,nCurBar=0;

double r1,r2,r3,r4,r5,r6;
int rt1,rt2,rt3,rt4,rt5,rt6;
double s1,s2,s3,s4,s5,s6;
int st1,st2,st3,st4,st5,st6;

//+------------------------------------------------------------------+
int init()
  {
   deinit() ;
   return(0);
  }

//+------------------------------------------------------------------+
int deinit()
  {

   ObjectDelete("Trend DN-0");
   ObjectDelete("Trend Up-0");
    return(0);
  }

//+------------------------------------------------------------------+
int start()
{

DoPlot() ;

for(nCurBar=0; nCurBar<myBars-1; nCurBar++)
{
   if(Low[nCurBar] < Low[st1])
      {
      s6=s5; s5=s4; s4=s3; s3=s2; s2=s1; s1=Low[nCurBar];
      st6=st5; st5=st4; st4=st3; st3=st2; st2=st1; st1=nCurBar;
      }
   if(High[nCurBar] > High[rt1])
      {
      r6=r5; r5=r4; r4=r3; r3=r2; r2=r1; r1=High[nCurBar];
      rt6=rt5; rt5=rt4; rt4=rt3; rt3=rt2; rt2=rt1; rt1=nCurBar;
      }
}

ObjectMove("Trend DN-0",0,Time[st1],s1);
ObjectMove("Trend DN-0",1,Time[st2],s2);
ObjectMove("Trend UP-0",0,Time[rt1],r1);
ObjectMove("Trend UP-0",1,Time[rt2],r2);

WindowRedraw();

Comment(

"s1 " , DoubleToStr(s1,Digits) , "\n" ,
"st1 " , DoubleToStr(st1,Digits) , "\n" ,
"s2 " , DoubleToStr(s2,Digits) , "\n" ,
"st2 " , DoubleToStr(st2,Digits) , "\n" ,
"s3 " , DoubleToStr(s3,Digits) , "\n" ,
"st3 " , DoubleToStr(st3,Digits) , "\n" ,
"s4 " , DoubleToStr(s4,Digits) , "\n" ,
"st4 " , DoubleToStr(st4,Digits) , "\n" ,

"r1 " , DoubleToStr(r1,Digits) , "\n" ,
"rt1 " , DoubleToStr(rt1,Digits) , "\n" ,
"r2 " , DoubleToStr(r2,Digits) , "\n" ,
"rt2 " , DoubleToStr(rt2,Digits) , "\n" ,
"r3 " , DoubleToStr(r3,Digits) , "\n" ,
"rt3 " , DoubleToStr(rt3,Digits) , "\n" ,
"r4 " , DoubleToStr(r4,Digits) , "\n" ,
"rt4 " , DoubleToStr(rt4,Digits) , "\n" ,

"") ;

   return(0);
  }
//+------------------------------------------------------------------+

void DoPlot()
{

   if(cnt<2)
   {
      if (ObjectFind("Trend DN-"+cnt) != 0)
      {
      ObjectCreate("Trend DN-"+cnt,OBJ_TREND,0,0,0,0,0);
      ObjectSet("Trend DN-"+cnt,OBJPROP_COLOR,ColorTrendDn);
      }

      if (ObjectFind("Trend UP-"+cnt) != 0)
      {
      ObjectCreate("Trend UP-"+cnt,OBJ_TREND,0,0,0,0,0);
      ObjectSet("Trend Up-"+cnt,OBJPROP_COLOR,ColorTrendUp);
      }
   }

    ObjectSet("Trend DN-0",OBJPROP_COLOR,ColorTrendDn);
    ObjectSet("Trend Up-0",OBJPROP_COLOR,ColorTrendUp);

}

//+------------------------------------------------------------------+
But it doesn't do exactly what you want...

From the last 300 bars indicator should find two MAXIMUM BARS (ONLY 2 HIGHEST BARS AMONG THE LAST 300 BARS) and draw the RED LINE and from the other hand the same indicator should find two MINIMUM BARS (ONLY 2 LOWEST BARS AMONG THE LAST 300 BARS) and draw the GREEN LINE as on the picture.
Look at the lines in the chart... They are plotted at the 2 Max and 2 Min bars for the period.
Everything will be OK, but ther is ONE PROBLEM.. I NEED draw trend lines AS:
SUPPORT LINE always UNDER prices (LOW) - current and historical
RESISTANCE LINE always ABOVE prices (HIGH) - current and historical
???
Hello
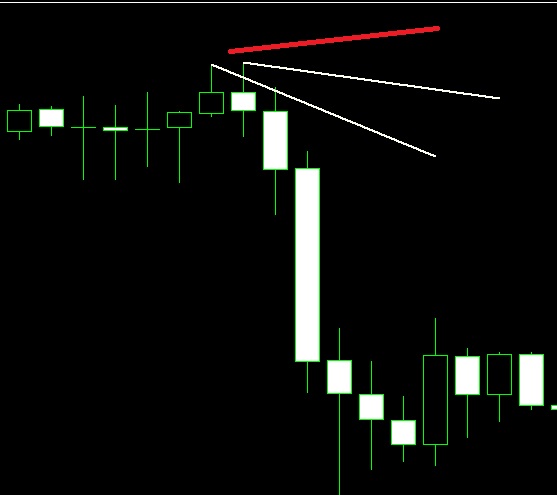
Can I create a line between 2 candles like Red Line in mql4?

Hello
Can I create a line between 2 candles like Red Line in mql4?
Be more specific
Hello
Can I create a line between 2 candles like Red Line in mql4?
I don't think it's possible.
//+------------------------------------------------------------------+
//|                                          Basing Candlesticks.mq4 |
//|                                                   Copyright © 2019, EarnForex.com |
//|                                       https://www.earnforex.com/ |
//+------------------------------------------------------------------+
#property copyright "Copyright 2019, EarnForex.com"
#property link      "https://www.earnforex.com/metatrader-indicators/Basing-Candlesticks/"
#property version   "1.00"
#property strict

#property description "Marks candlesticks with body < 50% of overall length (high-low range)."

#property indicator_chart_window
#property indicator_buffers 2
#property indicator_type1 DRAW_LINE
#property indicator_style1 STYLE_DOT
#property indicator_color1 clrBlue
#property indicator_width1 1
#property indicator_type2 DRAW_LINE
#property indicator_style2 STYLE_DOT
#property indicator_color2 clrBlue
#property indicator_width2 1

input int Percentage = 50; // Percentage for Basing Candle calculation.
input int TriggerCandle = 1; // TriggerCandle: Number of candle to check for alerts.
input bool EnableNativeAlerts = false; // EnableNativeAlerts: Alert popup inside platform.
input bool EnableSoundAlerts = false; // EnableSoundAlerts: Play a sound on alert.
input bool EnableEmailAlerts = false; // EnableEmailAlerts: Send an email on alert.
input bool EnablePushAlerts = false; // EnablePushAlerts: Send a push notification on alert.
input string AlertEmailSubject = "";
input string AlertText = "";
input string SoundFileName      = "alert.wav";

double H[];
double L[];

datetime LastAlertTime = D'01.01.1970';

//+------------------------------------------------------------------+
//| Custom indicator initialization function                         |
//|------------------------------------------------------------------|
int init()
{
   SetIndexBuffer(0, H);
   SetIndexBuffer(1, L);

   LastAlertTime = Time[0];

   return(0);
}

//+------------------------------------------------------------------+
//| Custom indicator iteration function                              |
//+------------------------------------------------------------------+
int start()
{
   int ExtCountedBars = IndicatorCounted();
   if (ExtCountedBars < 0) return(-1);
   if (ExtCountedBars > 0) ExtCountedBars--;

   int i = Bars - ExtCountedBars - 1;

   while(i >= 0)
   {
      double length = High[i] - Low[i];
      double body = MathAbs(Open[i] - Close[i]);
      double percentage = (double)Percentage / 100.0;
      if ((length != 0) && (body / length < percentage))
      {
         H[i] = Open[i];
         L[i] = Close[i];
      }
      else
      {
         H[i] = EMPTY_VALUE;
         L[i] = EMPTY_VALUE;
      }
           i--;
   }

   if (Time[0] > LastAlertTime)
        {
           string Text;
        // Basing Candle Alert
        if (H[TriggerCandle] != EMPTY_VALUE)
        {
                Text = AlertText + "Basing Candle Alert: " + Symbol() + " - " + TF2Str(Period()) + ".";
                if (EnableNativeAlerts) Alert(Text);
                if (EnableEmailAlerts) SendMail(AlertEmailSubject + "Basing Candle Alert", Text);
                if (EnableSoundAlerts) PlaySound(SoundFileName);
                if (EnablePushAlerts) SendNotification(Text);
                LastAlertTime = Time[0];
        }
   }
   return(0);
}

//+------------------------------------------------------------------+
//| Converts Period() to normal string value.                        |
//+------------------------------------------------------------------+
string TF2Str(int period)
{
   switch(period)
   {
      case PERIOD_M1: return("M1");
      case PERIOD_M5: return("M5");
      case PERIOD_M15: return("M15");
      case PERIOD_M30: return("M30");
      case PERIOD_H1: return("H1");
      case PERIOD_H4: return("H4");
      case PERIOD_D1: return("D1");
      case PERIOD_W1: return("W1");
      case PERIOD_MN1: return("MN");
      default: return("Unknown");
   }
   return(EnumToString((ENUM_TIMEFRAMES)Period()));
}
//+------------------------------------------------------------------+
- Free trading apps
- Over 8,000 signals for copying
- Economic news for exploring financial markets
You agree to website policy and terms of use
I would like to draw automatically on 30 MIN chart two lines (support and resistance) indicated by the last 300 bars. From the last 300 bars indicator should find two MAXIMUM BARS (ONLY 2 HIGHEST BARS AMONG THE LAST 300 BARS) and draw the RED LINE and from the other hand the same indicator should find two MINIMUM BARS (ONLY 2 LOWEST BARS AMONG THE LAST 300 BARS) and draw the GREEN LINE as on the picture.