4hr. Chart Settings:
5 EMA applied to the close
10 EMA applied to the close
Stochastics (10,3,3) (Use slow and simple settings)
RSI (9) (Simple)
When I open the moving average indicator, in the parameter tab I see period, shift method and apply to options, how do I set the following :
5 EMA applied to the close
10 EMA applied to the close
Then there is levels tab which I don't know how to use.
Under Oscillators, when I select RSI, ther is Periods, apply to, fixed min and fixed max options and I do not know how to set the following :
RSI (9) (Simple)
And there are ither variables in the Levels tab. It is a bit confusing.
I already submitted this in babypips web site, and was asked to post this here.
Dear Donsls,
For 5 EMA, Period = 5, MA Method = Exponential, Apply to = Close
10 EMA, Period = 10, MA Method = Exponential, Apply to = Close
RSI(9) Simple, Period = 9, Apply to = Close
Levels tab is use to display additional horizontal level in seperated chart window (ie. like RSI will display in the seperator chart window at bottom with two horizontal level at 30 and 70). The fixed max and fixed min is use to set range of y-axis of the seperated chart window. Hope this will help!
Thanks for the reply. Much appreciated. I have one more question. Could I apply 5 and 10 EMA on the same window. When I set it to 5 and open it again, it shows my previous (5ema). How do I apply 2 without overwritting the previous on the same chart?
Thanks for the reply. Much appreciated. I have one more question. Could I apply 5 and 10 EMA on the same window. When I set it to 5 and open it again, it shows my previous (5ema). How do I apply 2 without overwritting the previous on the same chart?
You can apply more than one indicator on the same chart. So that you can add hundreds of indicator on the same chart if your computer have enough memory. If you apply the same setting of a MA to the chart (say period = 5 and method = ema), of crouse, it will overwrite the previous one because they are exactly the same curve. Just try some other setting, for example, 5 period of a simple moving average (set period = 5 and method = Simple). It have slightly difference than 5ema.
Hello,
I am new to Meta 5 , I have been using Meta 4 for years now
When I close my charts each day and then re open the following day I need to re set all my toolbars / status bar / charts bar & time-frames etc
even when I save to my templates it needs re setting each time as it just gives me the blank chart with my asset & candles . { please see screenshot }
Is there a way to keep the landing meta 5 charts page the same as I left it the day before as this is time consuming and frustrating
I`m sure there`s something simple I am missing and will appreciate any help
Thank you
Hi Ross,
There are two things you could try.
1. You already mentioned that you've saved your set-ups as templates, but it might be worth trying to save your preferred template as the "Default" template. To do this:
- Set-up the chart with all of the indicators/color arrangement you like
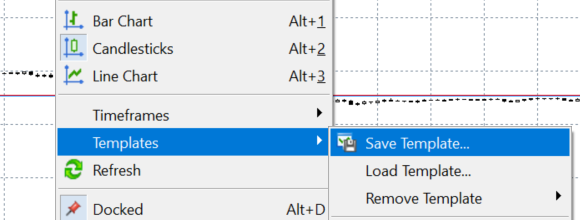
- Right-click on the chart and select "Templates/Save template"

- Then save the tempalte file under the name "Default"
- From now on, every time you open a chart, it should display the chart based on this default template. You can change the default
template at any time.
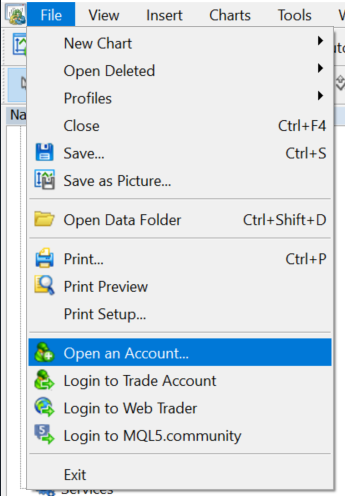
2. If this doesn't solve your issue, then I would recommend that you try to install the stock version of Metatrader 5. Some brokers (including Binary.com which it looks like you are using) provide their own "version" of MT5; sometimes this comes with additional features, but sometimes this has some un-intended effects (such as the one you're facing). Try downloading and installing the stock version of Metatrader 5 from the official site here, and then log-into your account by:
- Going to the "File/Open an Account..." tab

- www.metatrader5.com
- Free trading apps
- Over 8,000 signals for copying
- Economic news for exploring financial markets
You agree to website policy and terms of use


4hr. Chart Settings:
5 EMA applied to the close
10 EMA applied to the close
Stochastics (10,3,3) (Use slow and simple settings)
RSI (9) (Simple)
When I open the moving average indicator, in the parameter tab I see period, shift method and apply to options, how do I set the following :
5 EMA applied to the close
10 EMA applied to the close
Then there is levels tab which I don't know how to use.
Under Oscillators, when I select RSI, ther is Periods, apply to, fixed min and fixed max options and I do not know how to set the following :
RSI (9) (Simple)
And there are ither variables in the Levels tab. It is a bit confusing.
I already submitted this in babypips web site, and was asked to post this here.