Moving Average Cross Signal
- Indicators
-
Mikhail Sergeev
 Mikhail Sergeev is a qualified specialist in the field of trading with 17 years of experience. An expert in the development of indicators and trading systems for MetaTrader 5.
I work in a team with the best guys from TrendRiders. Together we create powerful tools for analyzing stock charts. - Version: 2.2
- Updated: 13 January 2026
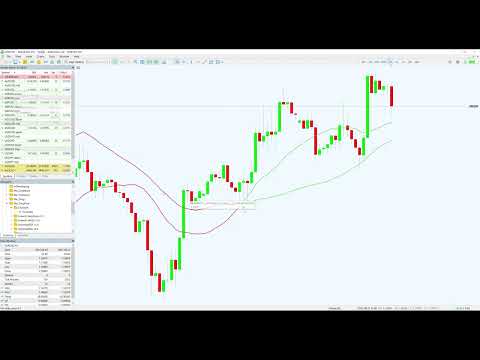
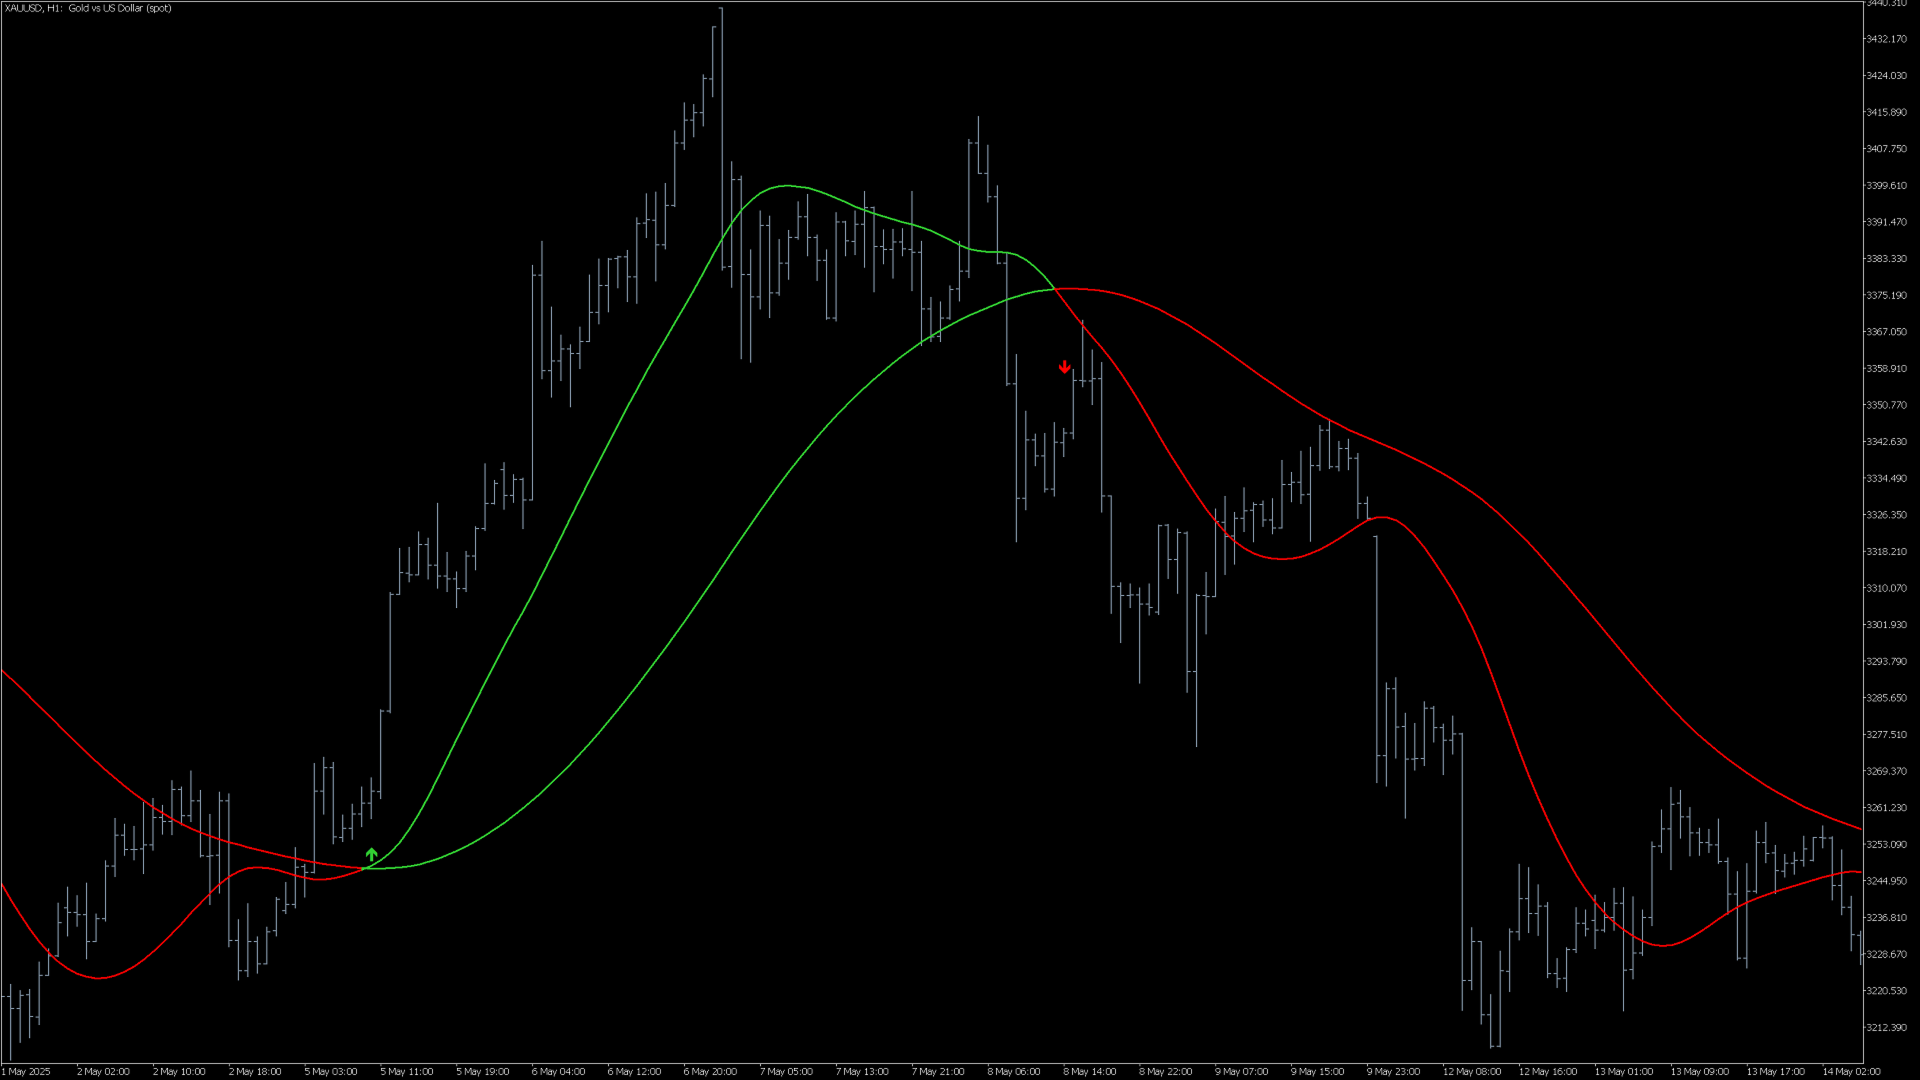
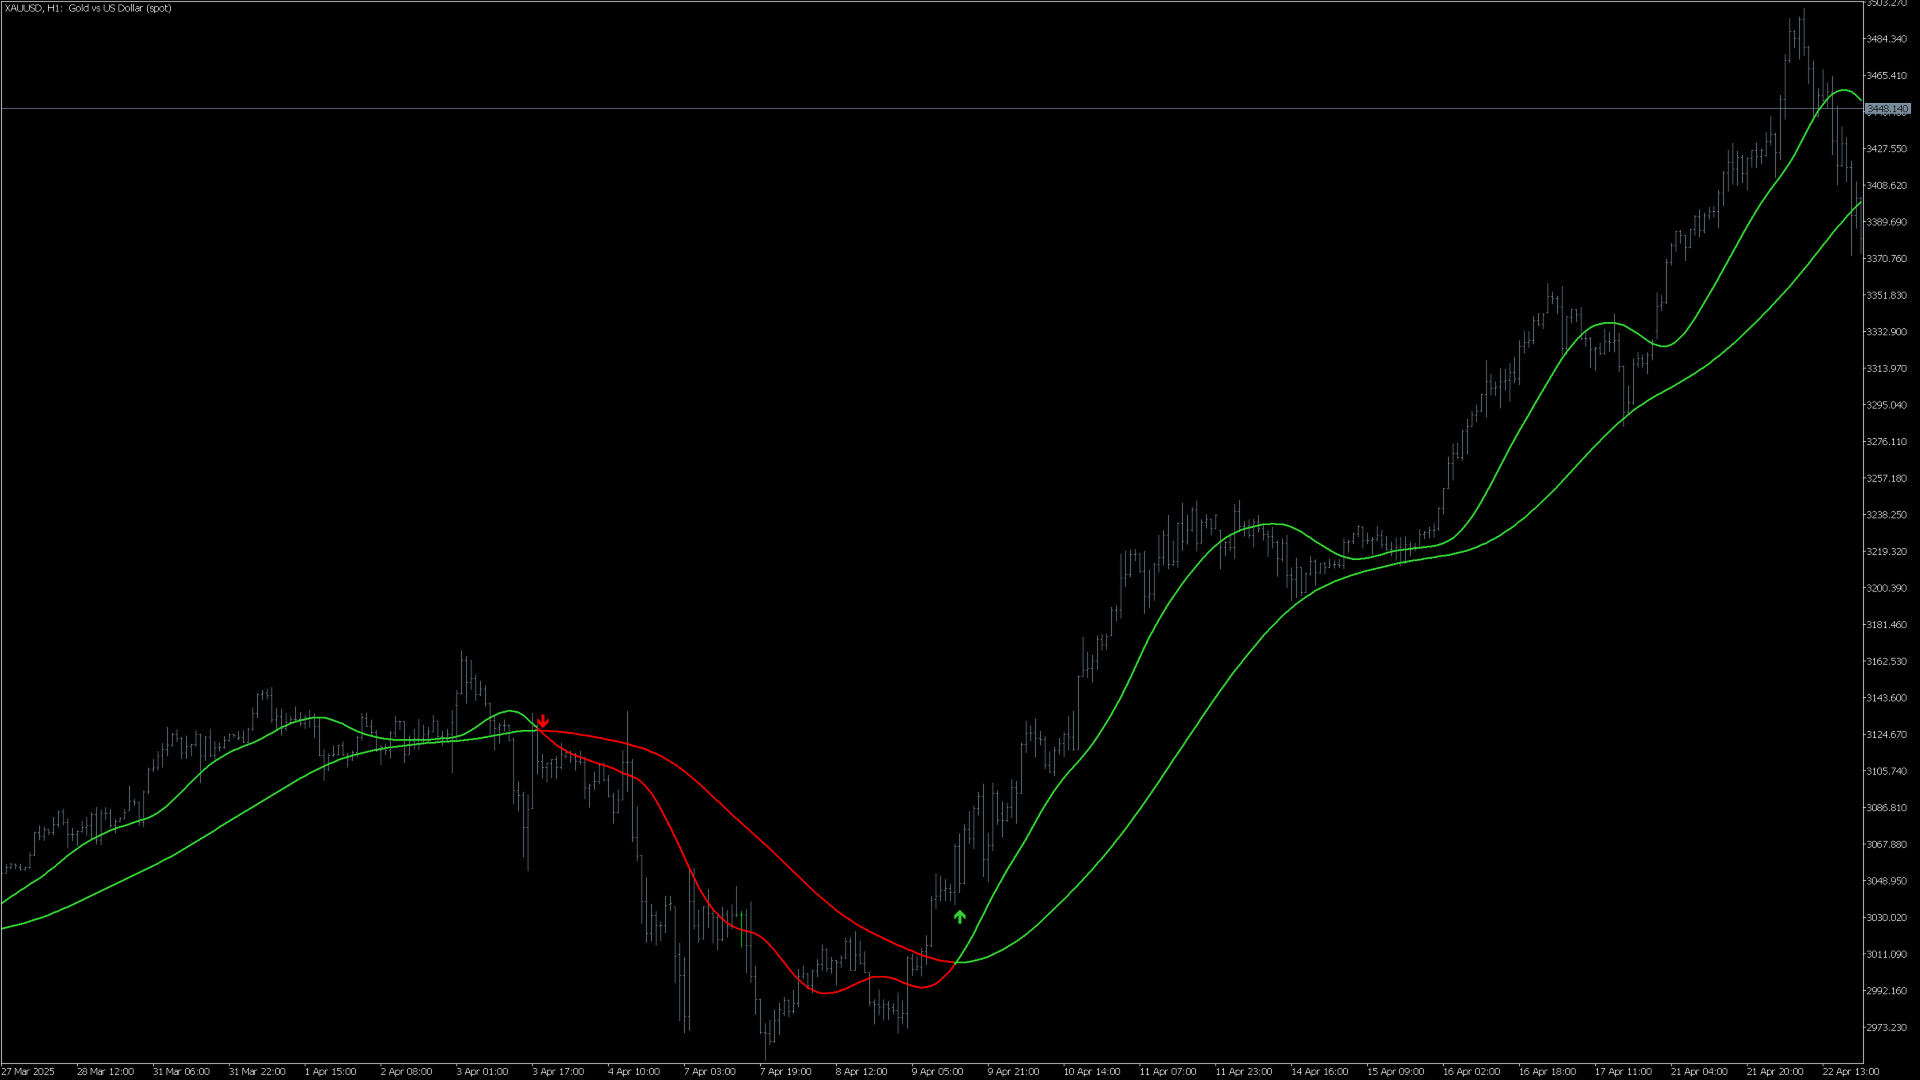
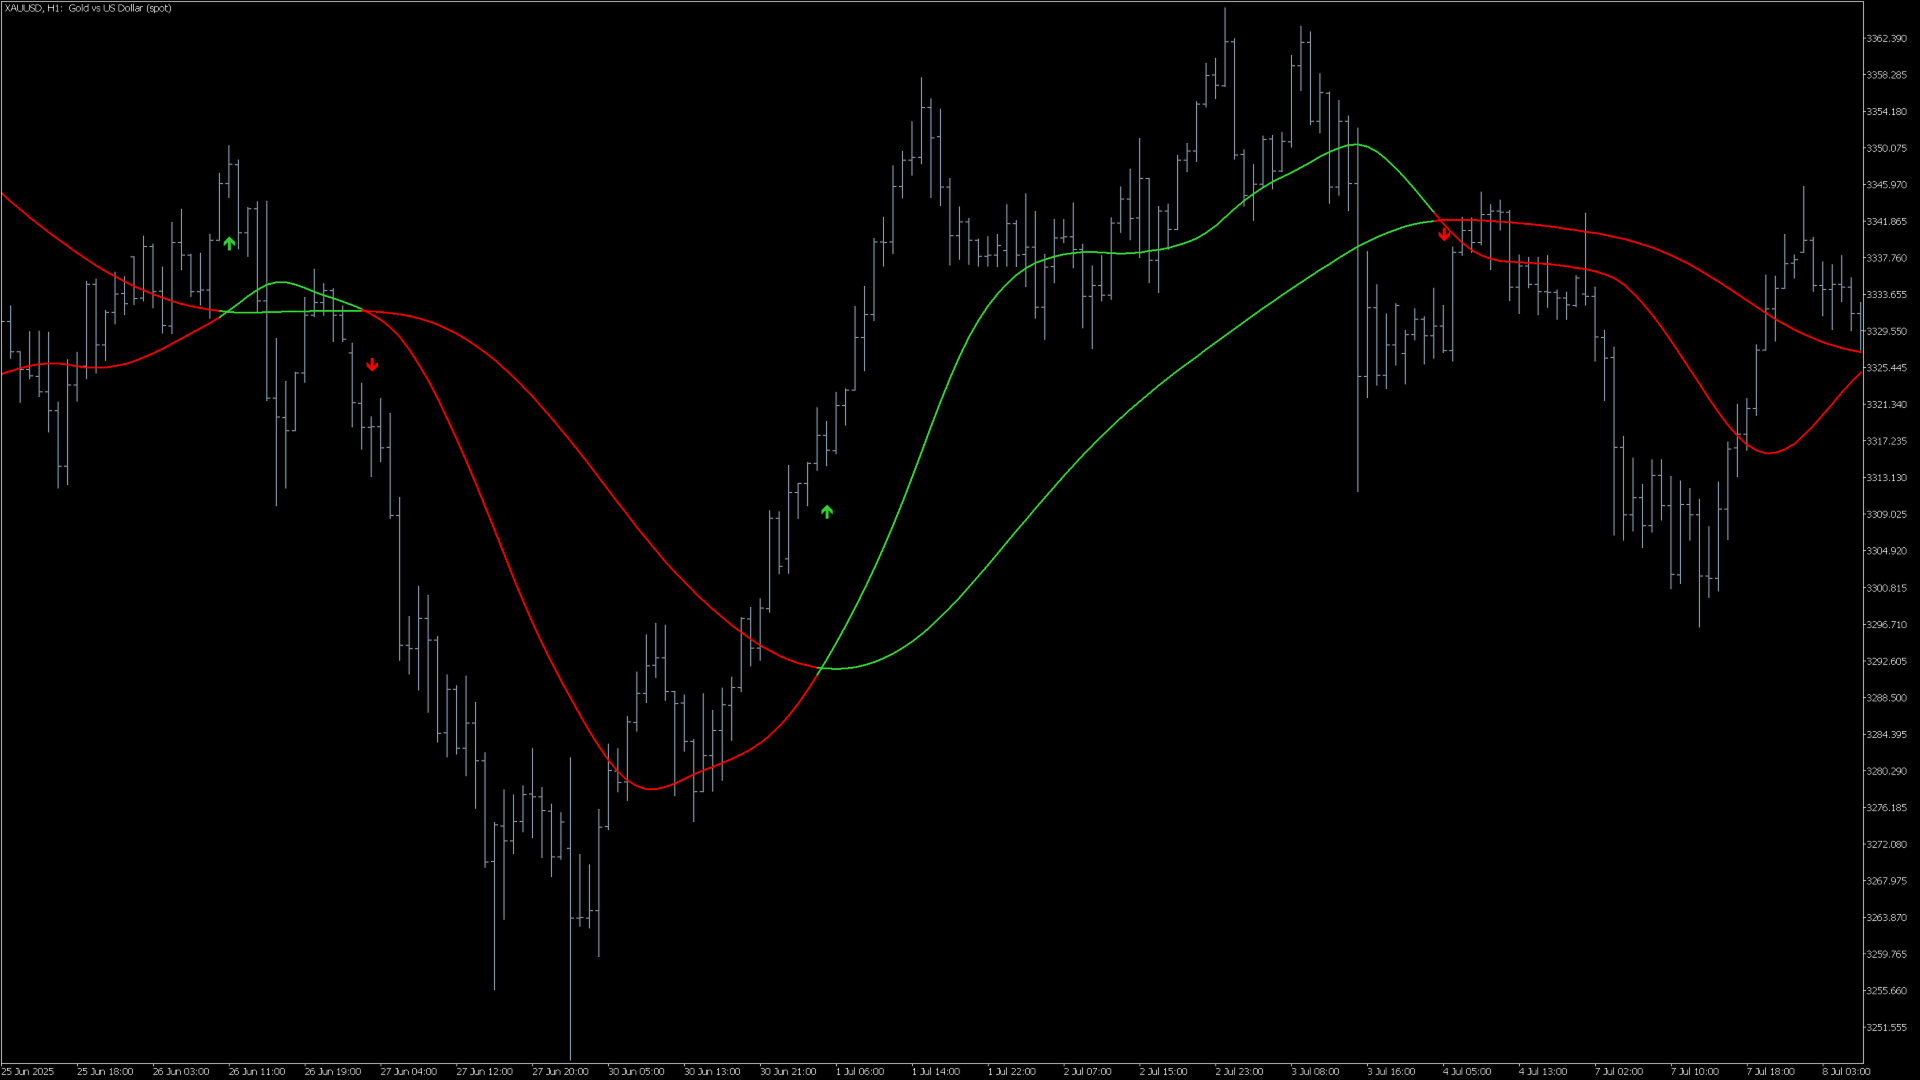
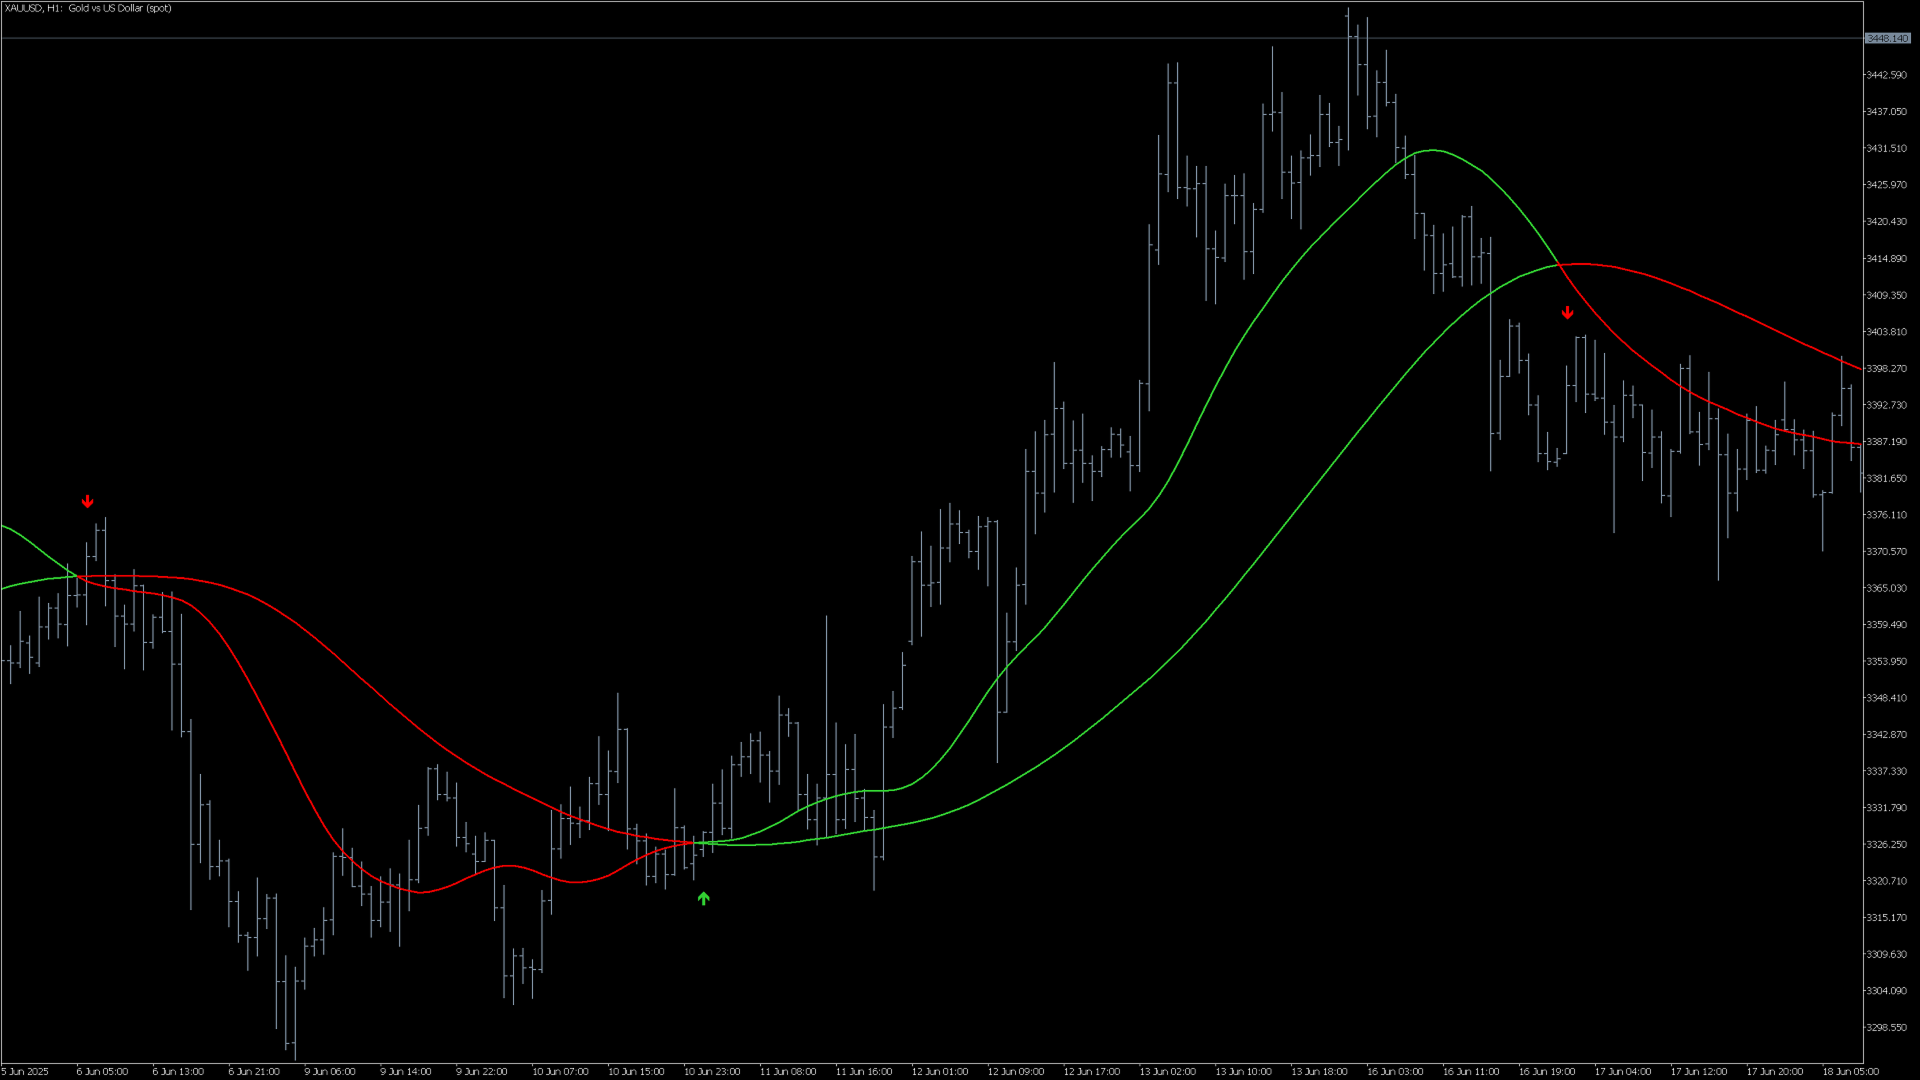
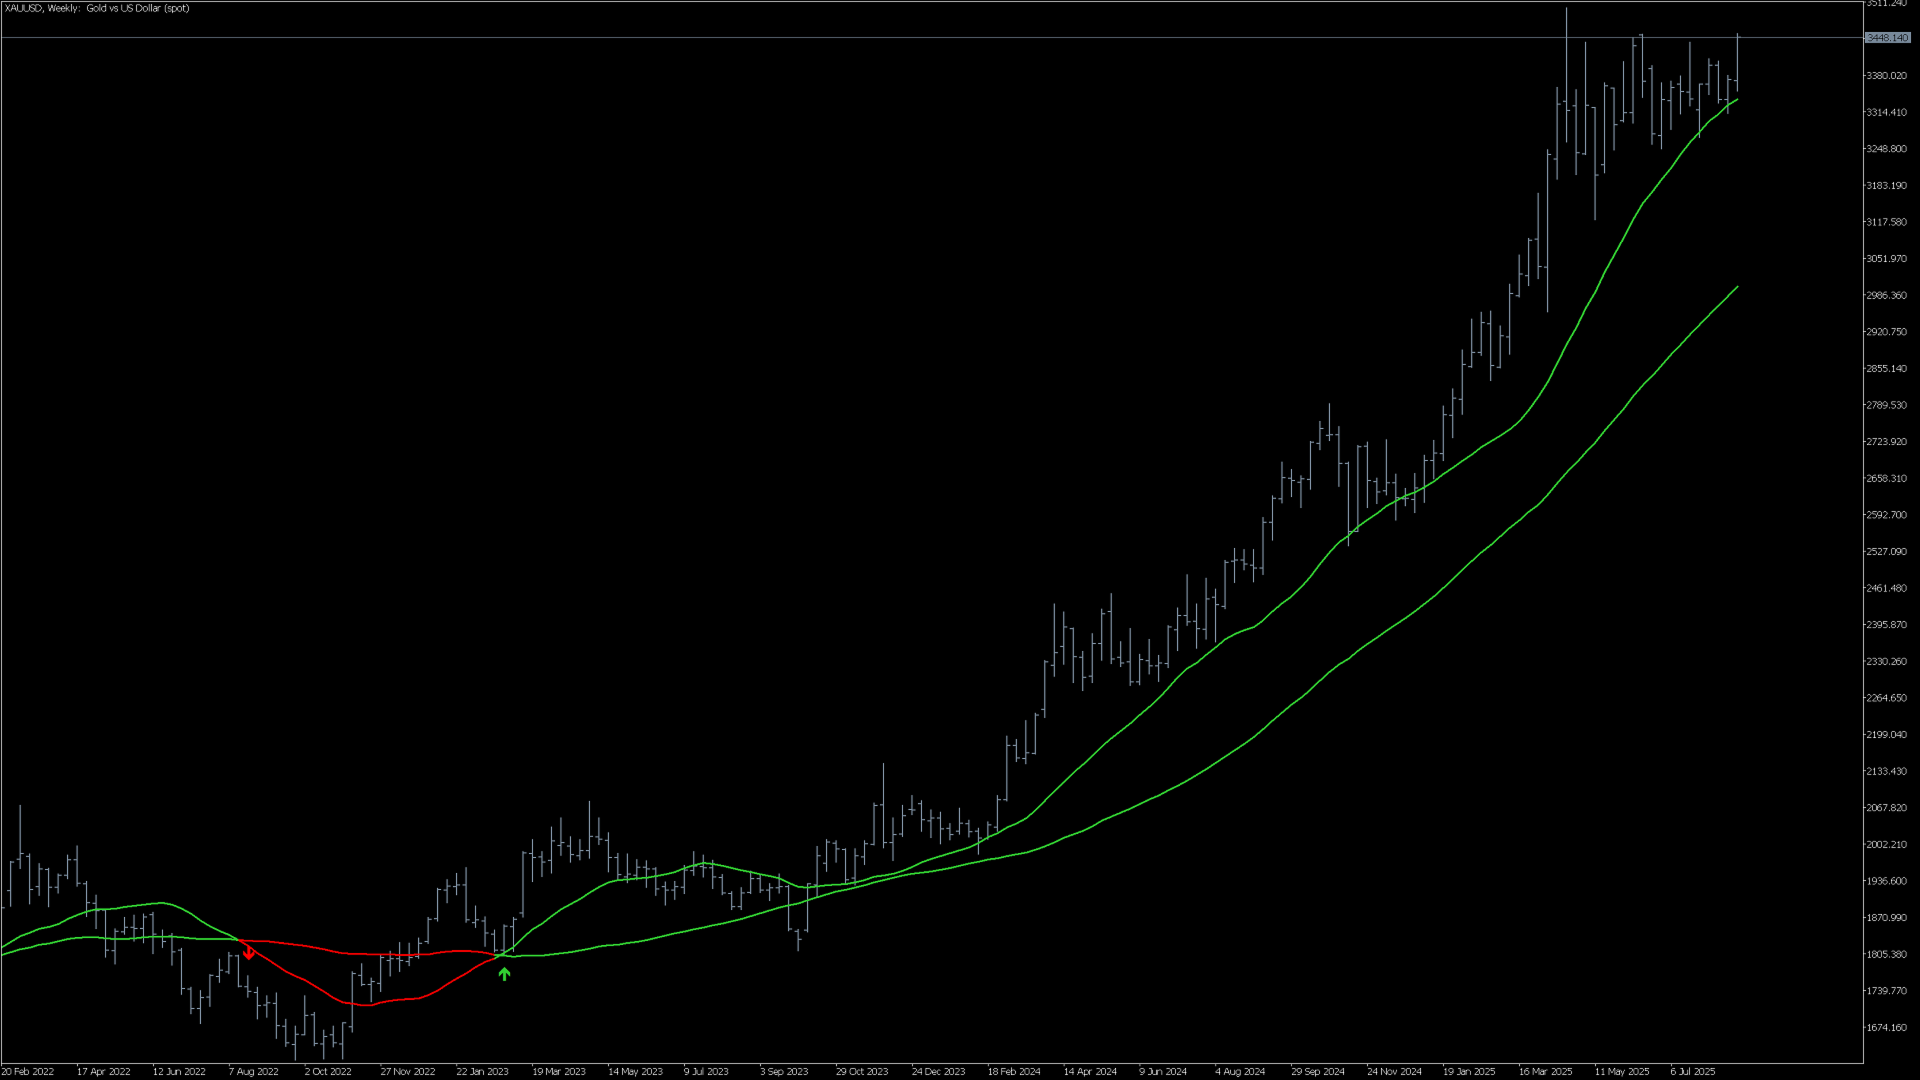
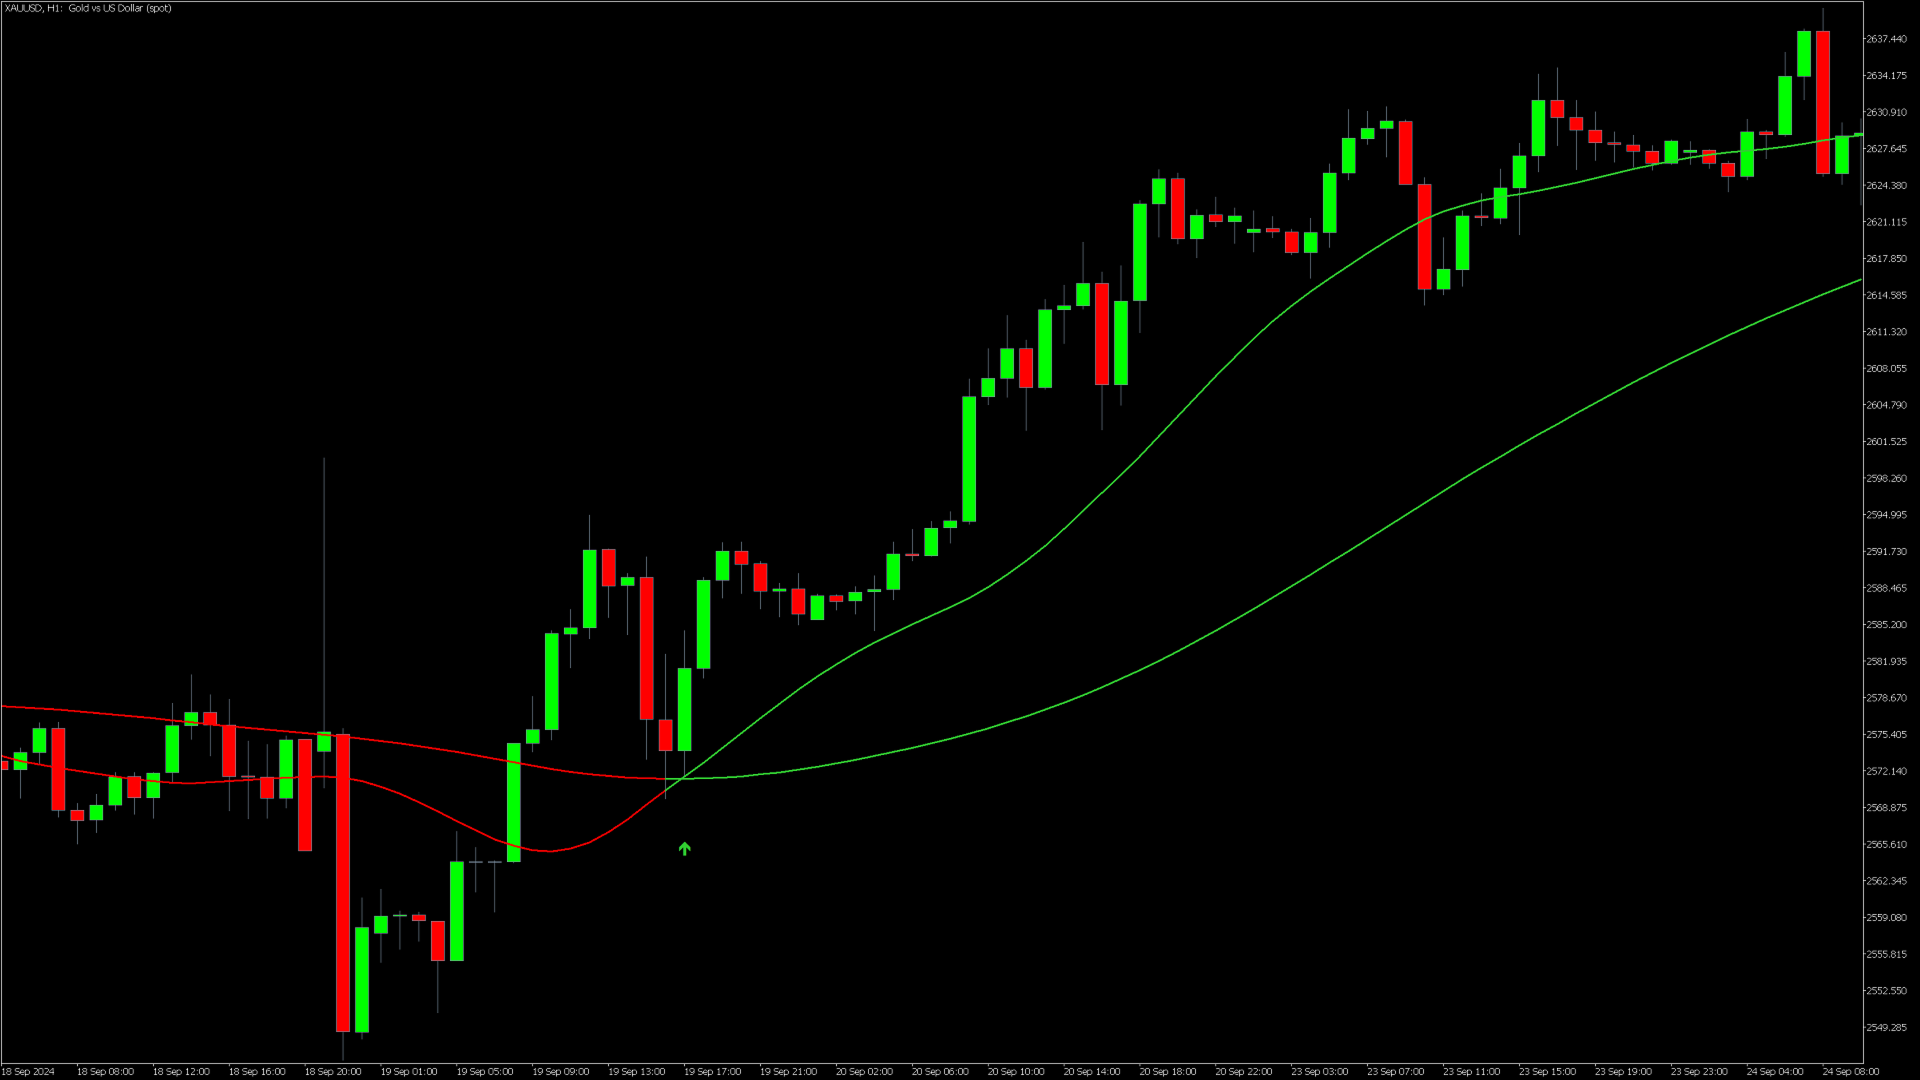
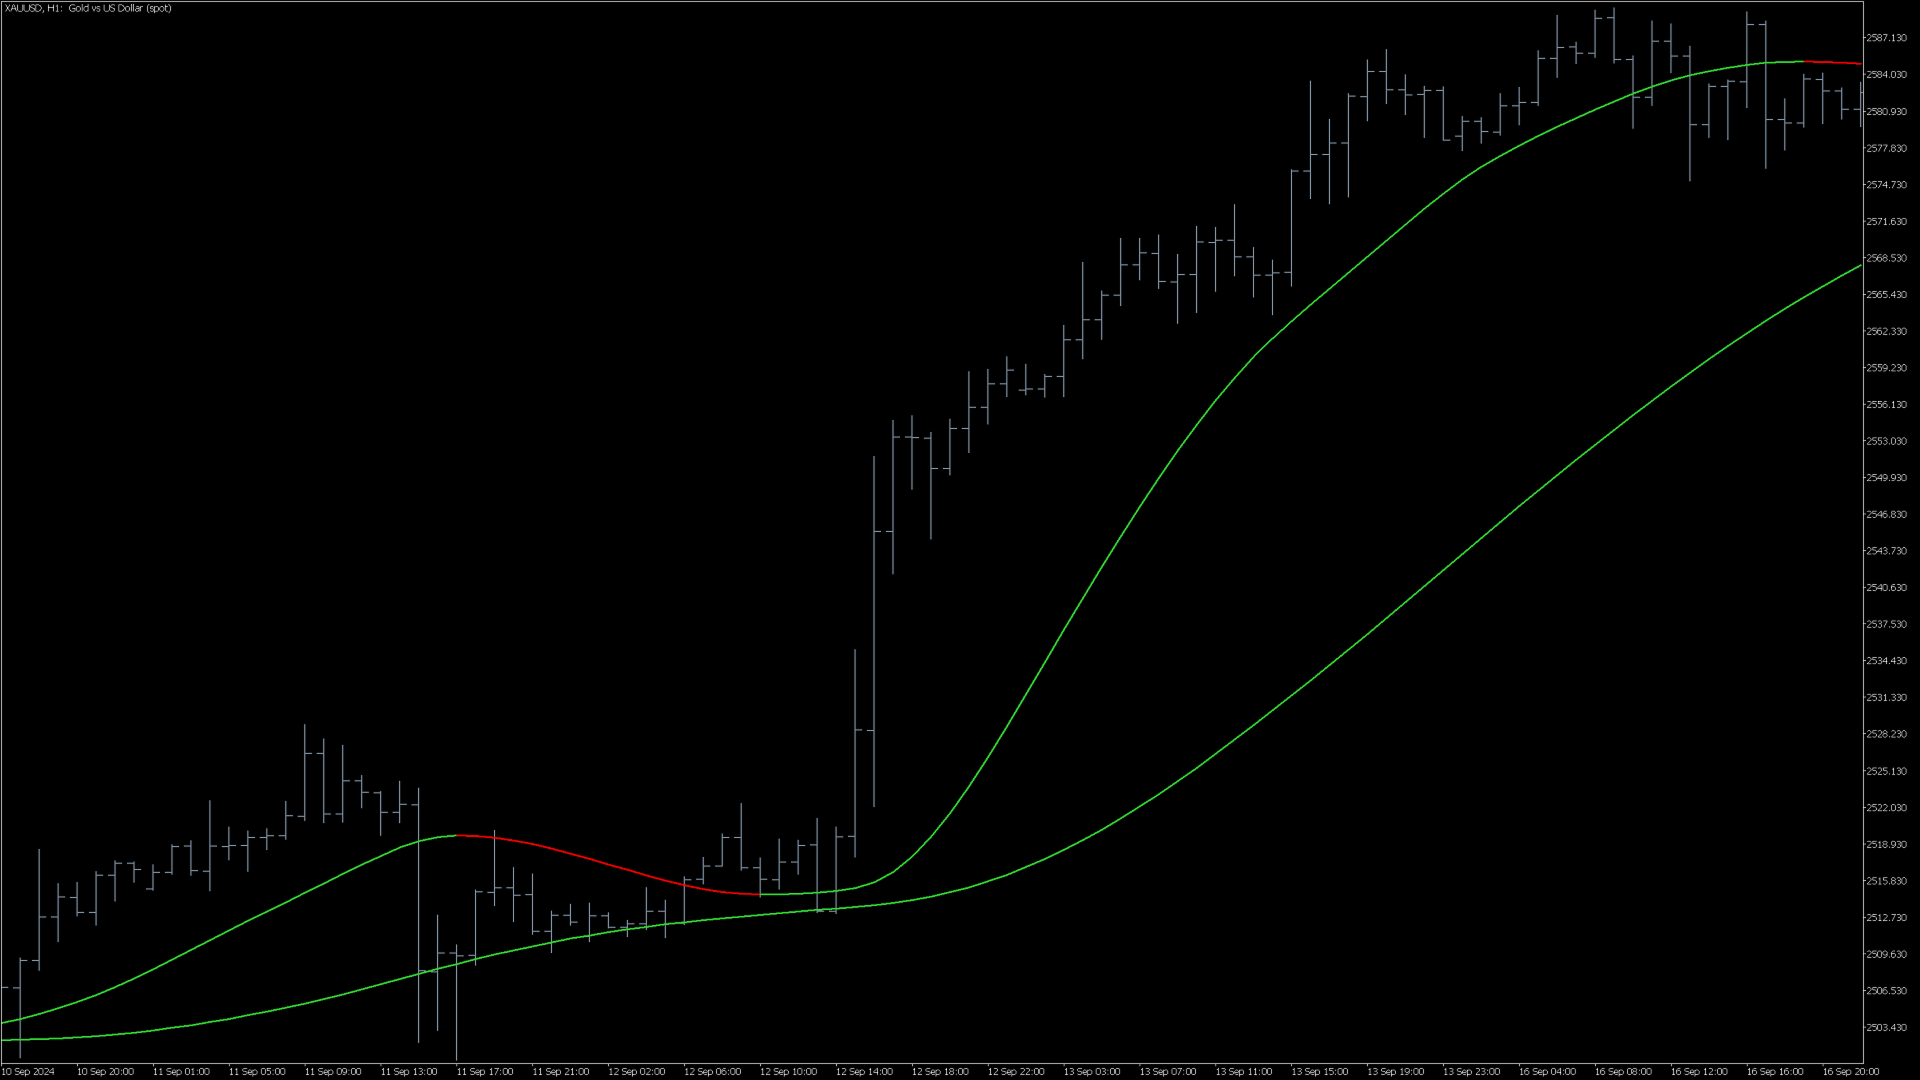
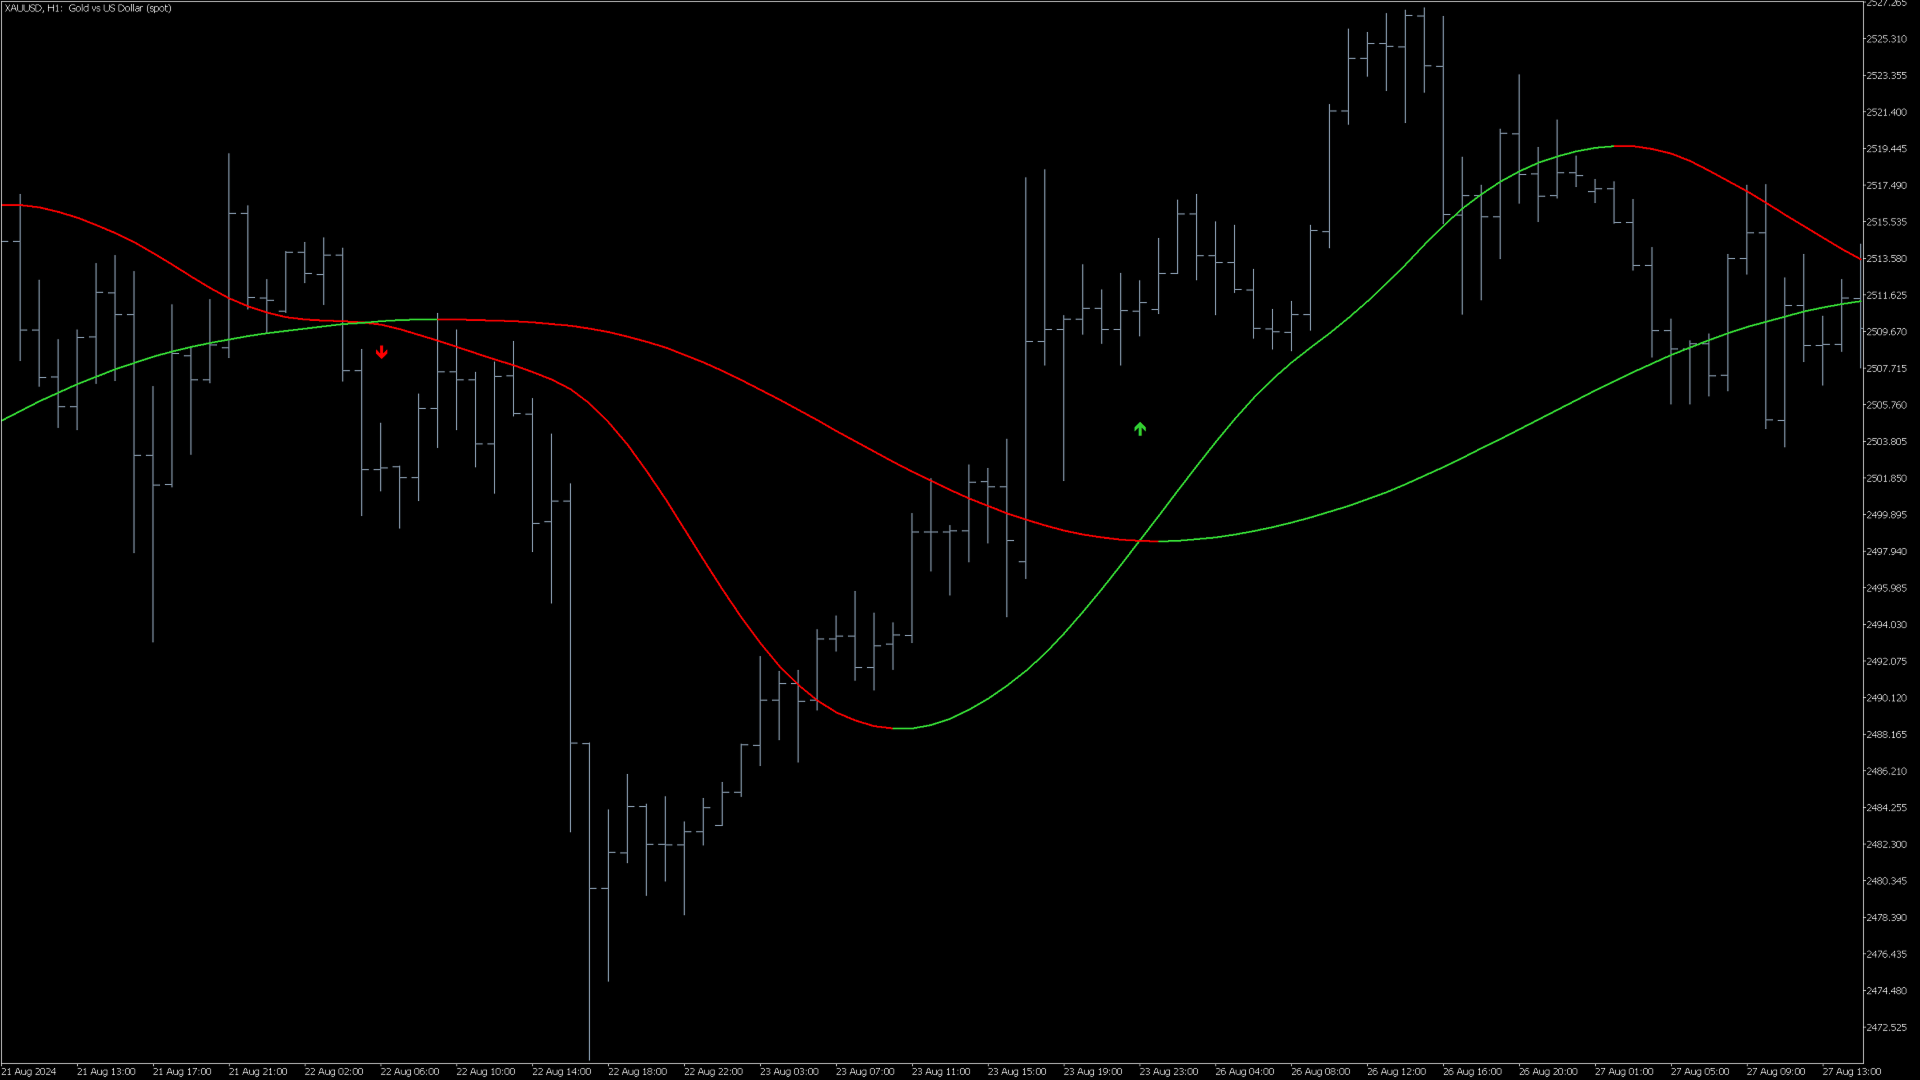
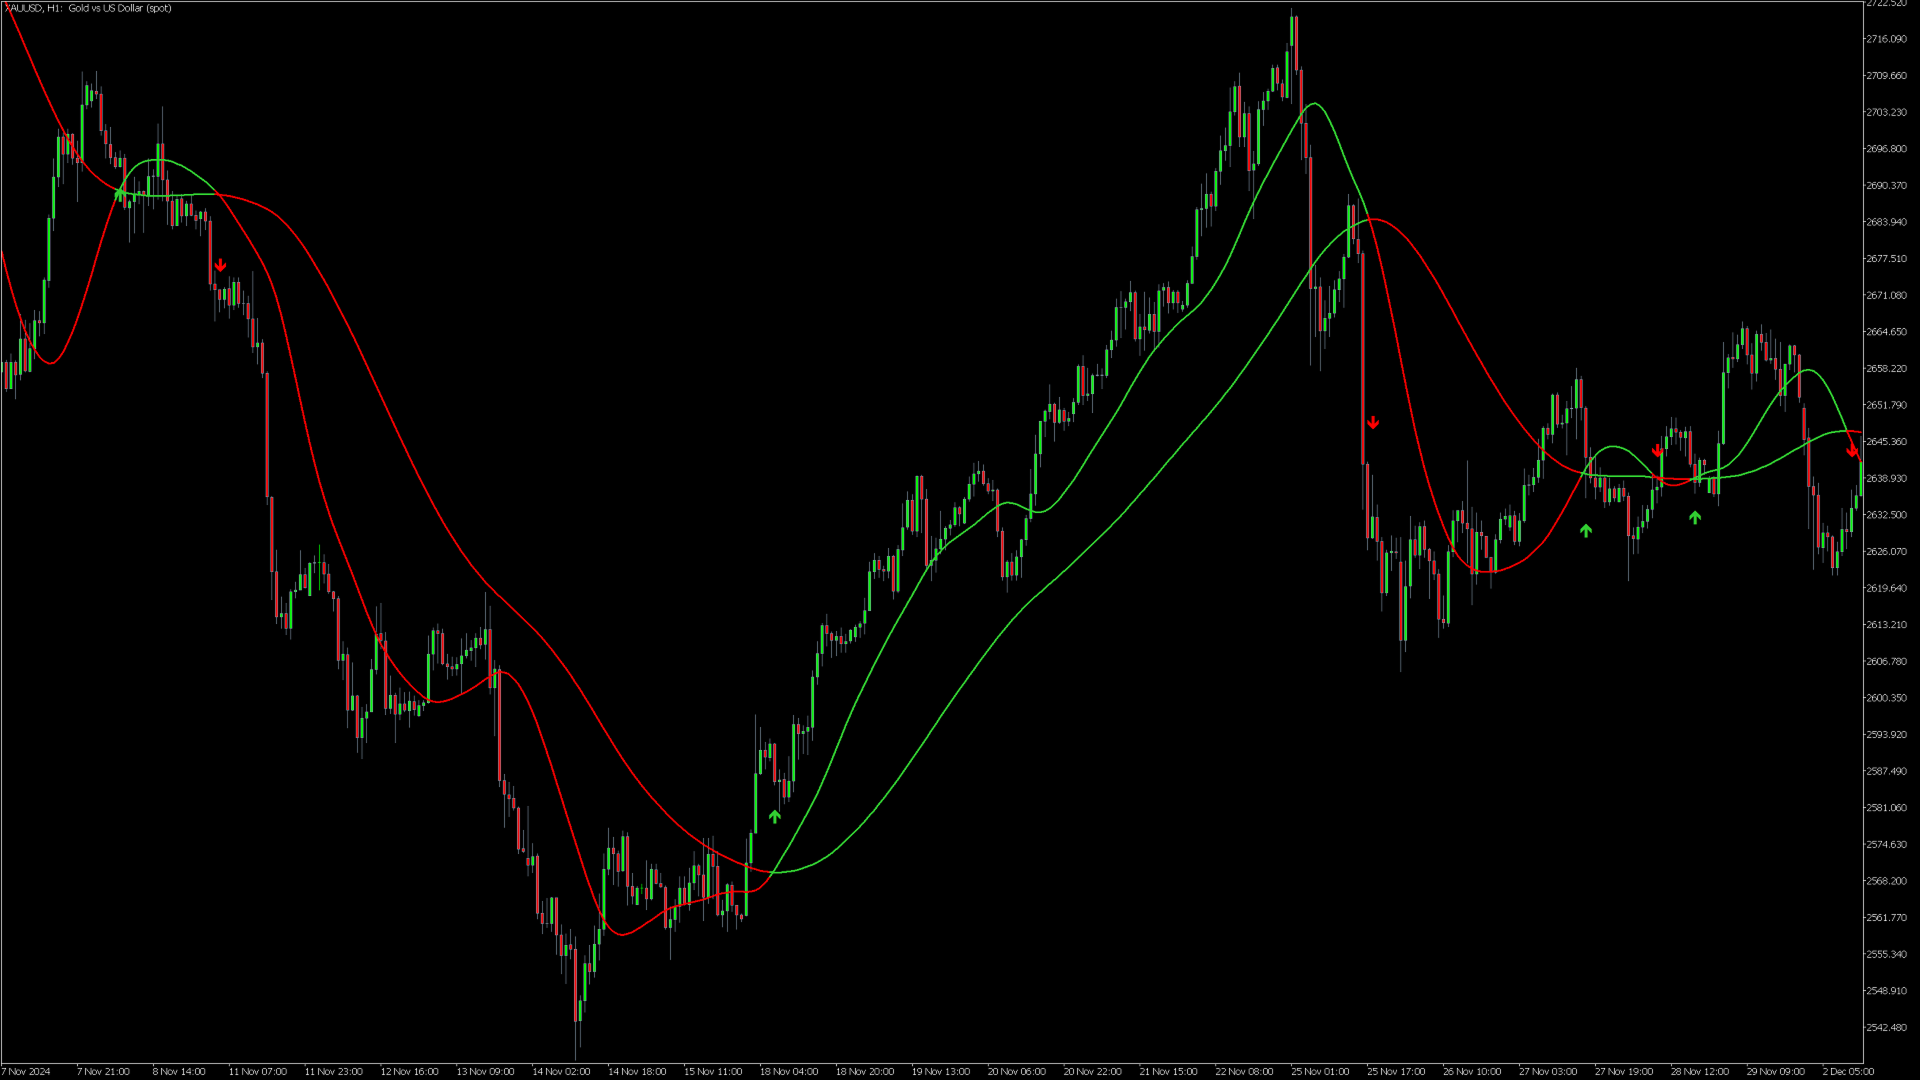
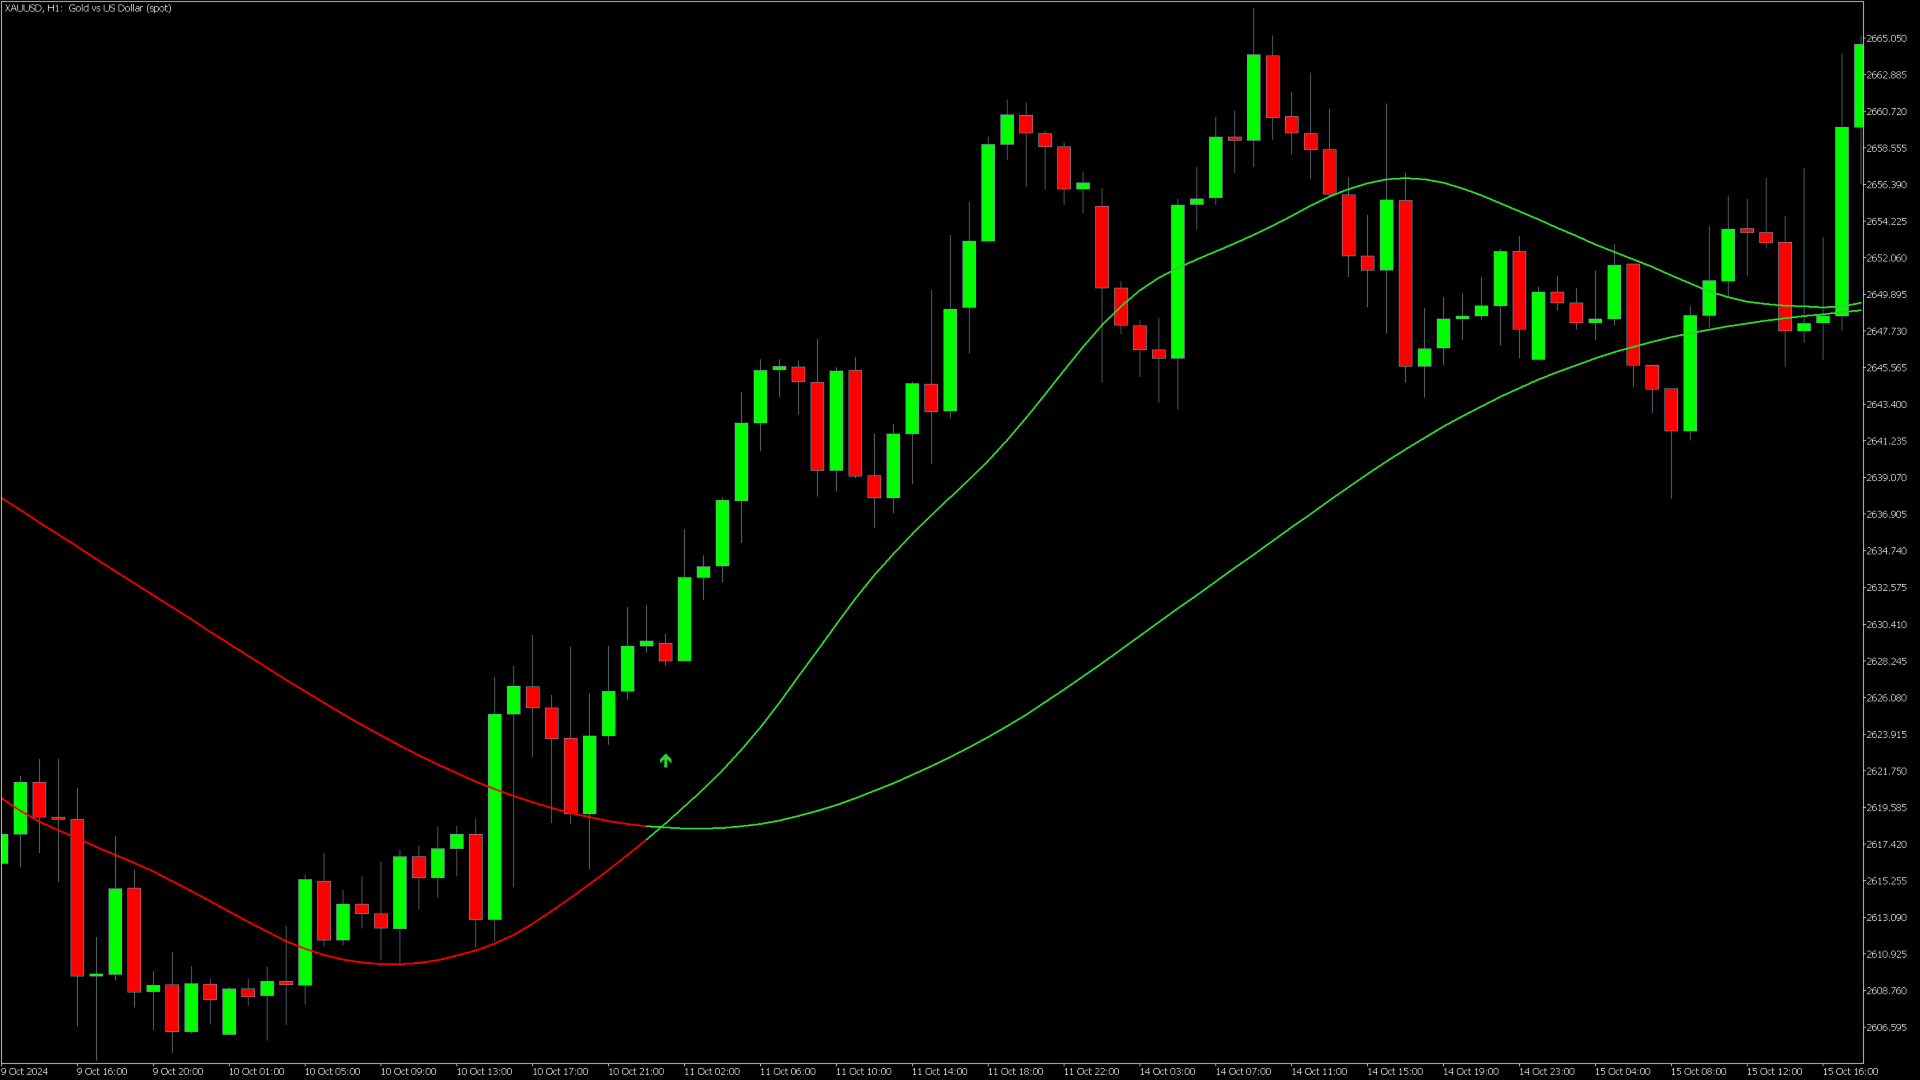
If you trade with moving averages, this indicator will be your best assistant. Here's what it can do: it shows signals when two moving averages intersect (for example, a fast moving average breaks through a slow moving average from bottom to top - growth is possible). It notifies you in all ways: it beeps in the terminal, sends a notification to your phone and an email to your email — now you definitely won't miss a deal. It can be flexibly adjusted: you can choose exactly how to calculate the moving average (there are more than 10 options available), choose colors, periods and other parameters for your strategy.
A tool for those who like moving averages. No need to sit at the screen — it will tell you when it's time to act. And if you want to experiment, the settings will help you adapt it even for scalping, even for long-term trading. The indicator has a quick code and can be easily integrated into your trading robot.
There are two types of signals and alerts sent. The first signal comes when there is a chance that the condition will be met, that is, the bar has not closed yet and there may be changes. This allows you to take a seat at the computer, double-check the news or prepare for trading in any other way and not miss a drop of profit. The second signal comes when the arrow on the chart is already fully formed. Each type of signal is given only once per bar. This means that the indicator does not duplicate signals within the same price bar — you only receive one notification per period (for example, per minute or hour). Such a system helps to avoid redundancy and focus on up-to-date data.
I am currently automating a highly profitable trading strategy based on the intersection of moving averages. If you are interested in automated trading, you can see the results that I have managed to achieve so far: https://www.mql5.com/en/signals/2339244
Your feedback is very important to me. Do you have any questions or would you like to share your opinion? Write comments or send messages — I am always in touch!
Indicator Parameters
- Fast MA Mode - the method of calculating the fast moving average.
- Fast MA - the period of the fast moving average.
- Slow MA Mode - the method of calculating the slow moving average.
- Slow MA - the period of the slow moving average.
- SendEmail - sending by email.
- Alert - audio notification.
- PushNotification - notification to the mobile terminal.
- PaintArrow - arrows on the chart at the intersection of moving averages.
- ColorMethod - a variant of coloring moving averages.
- ModePaintProfit - profit output on the chart.
- Channel Expansion Method - select the option to expand the distance between the moving averages
- ChannelWidth - the size of the extension of the distance between the moving averages. 1.0 – without additional extension. 2.0 – the channel has been expanded by 2 times.
Is the moving average being redrawn (changing its values)?
The moving average does not redraw or change its values in history. However, on the current bar (for example, on M1 or H1), the value may fluctuate before the candle closes, so for accurate signals it is better to wait for its completion. For example, if you build a moving average based on the maximum prices of the bar, the moving average on the current bar will only be able to increase its values, since the maximum of the current bar cannot become less. Also, if you make the "Shift = 1" parameter, the current bar will not participate in the calculations, and the moving average will stop changing its values even on the current bar.
One way or another, you may encounter an algorithm for calculating a moving average that will change its values in history. This may be due to errors in the code, an attempt to mislead users, or an attempt to create a tool with a non-standard interpretation. All we can say here is that there are no such calculations in this indicator, and it is not being redrawn.
How to interpret signals from intersecting moving averages?
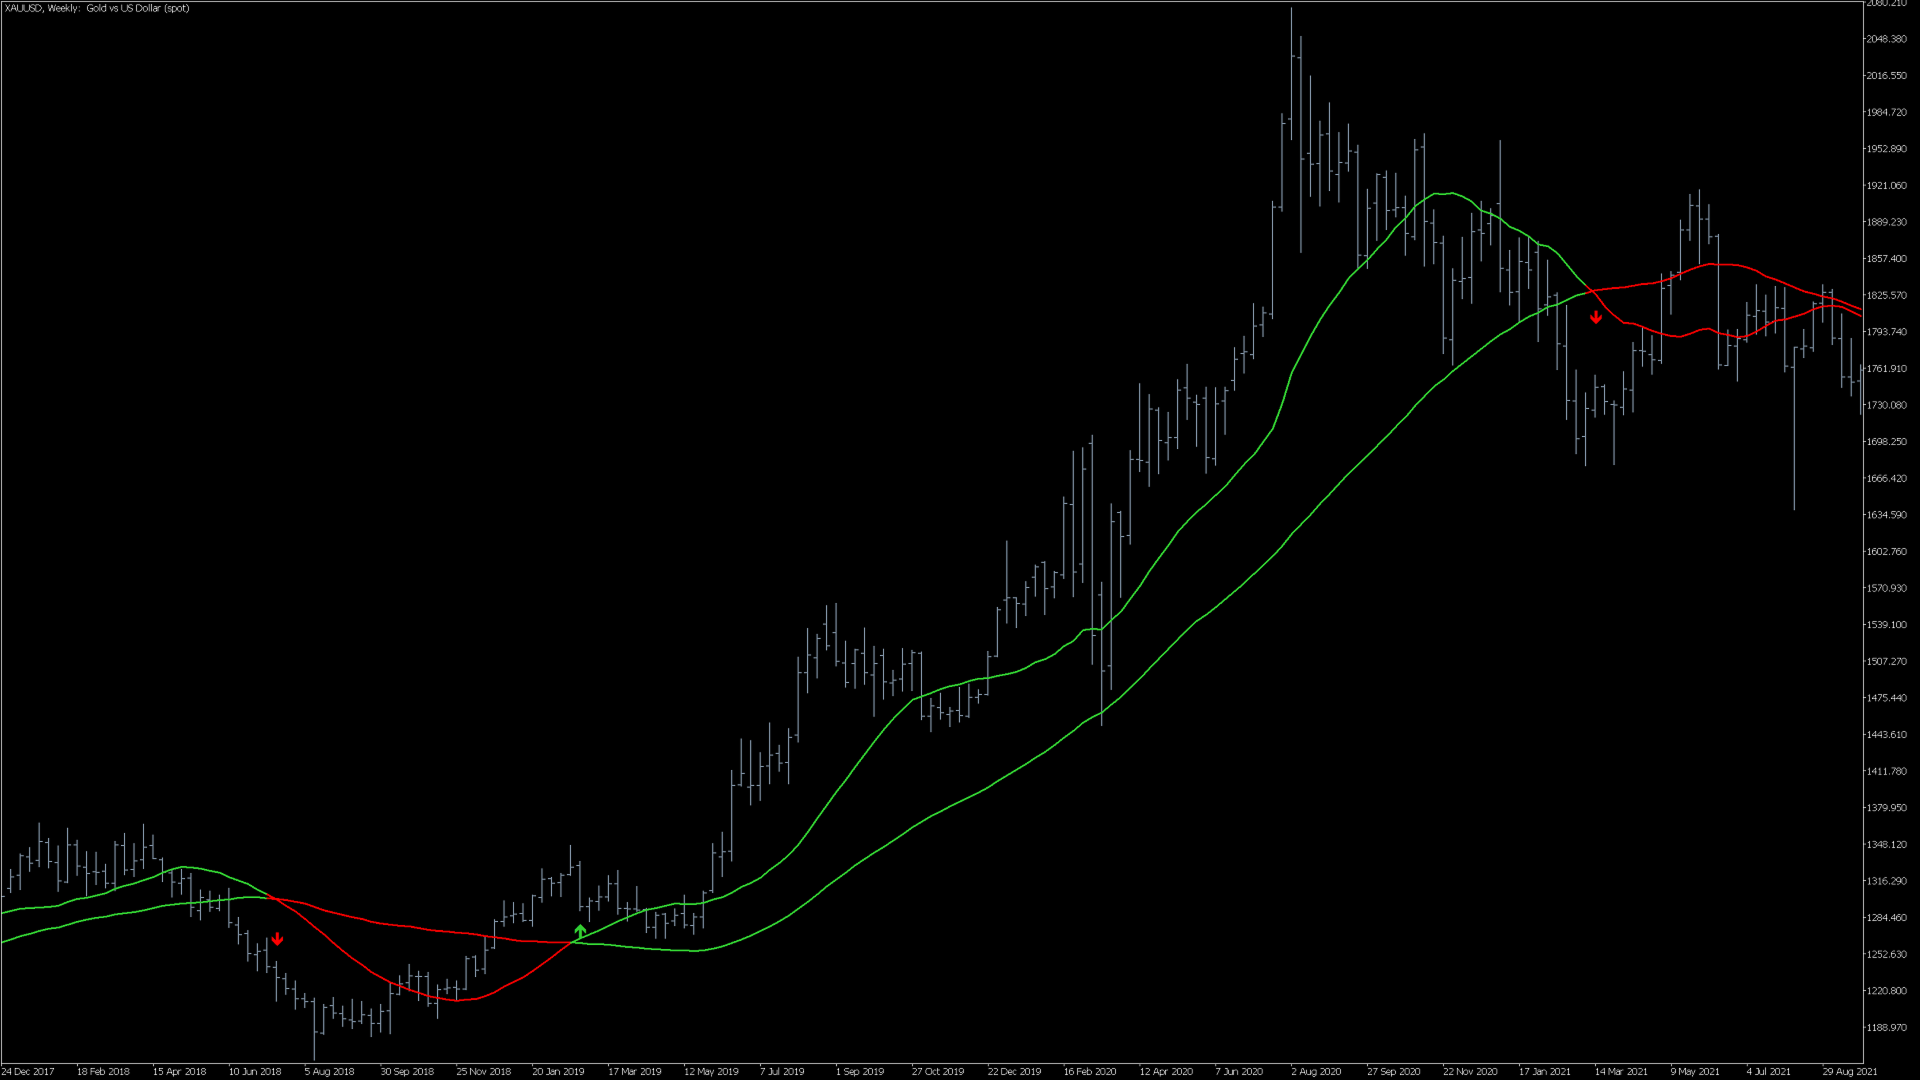
There are a lot of ways. The very fact of crossing is a good signal of a change in the nature of the price movement. You can use moving averages as support and resistance levels, or trade only when the price is between the two moving averages. Use the direction of the slow moving average as a trend indicator, and enter the market when the fast moving average changes its direction. Consider candle patterns only if they have touched the moving average line. In general, there are many ways, and you can also come up with your own unique and more effective options.
Striving for maximum convenience and efficiency. We have added to our indicator the ability to choose the interpretation method. We describe the most interesting of them in detail. You can see the ways to open positions on two moves in our blog.
I have developed a system based on this indicator, how can I automate it?
This free indicator can be used in your trading robots without restrictions. If you are a programmer, you can write such a robot yourself. Or go to the freelance section, there are many qualified specialists there.
If your idea is new and interesting, you can write to us and we will help with its automation. It would be a big plus if you, like us, want to develop the MQL trader community. Become a part of the movement — turn ideas into working tools, share experiences, and grow with the community!
How does this indicator differ from similar ones, and what is its advantage?
The main difference is the unique flexibility in the choice of smoothing methods. Unlike standard indicators, where only SMA, EMA or SMMA are available, dozens of algorithms are collected here: from classical to experimental. For example, parabolic approximation perfectly catches trend reversals, adaptive methods automatically adjust to volatility, and machine learning-based algorithms analyze historical patterns. This allows you to work in any market conditions: in a flat, the indicator ignores noise, and in a trend, it quickly reacts to changes. In addition, you can turn the line into a dynamic channel. This helps you visualize volatility and find overbought/oversold areas without using additional tools. A signal system with a choice of interpretation. You are not limited to standard intersections: you can customize filters or candle patterns.
It is inconvenient to have many different indicators. That's why we created this indicator so that the trader has everything he needs for analysis. The huge functionality allows you to flexibly fit into any automatic trading system, without having to reconnect different indicators in search of the best option.
Does it work with any tools?
Yes! The indicator is compatible with stocks, currencies, cryptocurrencies and commodity futures. The settings can be easily adapted to different markets: for example, for volatile assets, you can forcibly expand the distance between moving averages, and for long—term positions, increase the moving average periods or change the calculation method.
How do I create a system with your indicator? A practical example
Here's how you can use it in your strategy: set the SMA 200 (slow) and EMA 50 (fast), wait for an upward crossing + an above-average volume, open a position by 1% of the deposit, set the stop loss to a local minimum, and take profit is 2:1 relative to risk. But remember: the indicator is a tool, not a magic pill. Always add filters and test strategies on stories!
Data Security
No third-party libraries are connected. The indicator does not collect personal data — all calculations are performed locally on your device. Your settings, signals, and transaction history remain confidential. This is important for traders who value privacy and do not want to share strategies.
Need some help?
The author is always in touch: answers questions in the comments, helps with setup and solves problems. For example, if the indicator is "buggy" on a certain timeframe, we will find a solution together. You can also suggest your own idea for improvement — the best ones will be implemented in the next updates.


Reliable and repaint-free — works across all markets I already use other indicators from Mikhail Sergeev and they are all truly excellent. I've been trading for many years, so I know how to recognize a quality product when I see one. They offer reliability and no repaint, which is extremely important, along with immediate visibility on the chart, which also matters a lot. Above all, these are solid indicators across all timeframes and all instruments. I use them on Dax, crypto, and forex.