TDI Scanner Dashboard
- Indicadores
-
Abir Pathak
 I create MT4 and MT5 indicators. They are mainly arrows and scanner indicators and also some essential utilities.
I'm hoping they will make your trading easier and make you profitable.
You can join my Telegram channel to keep track of all products I post. - Versión: 1.12
- Actualizado: 25 noviembre 2024
- Activaciones: 20
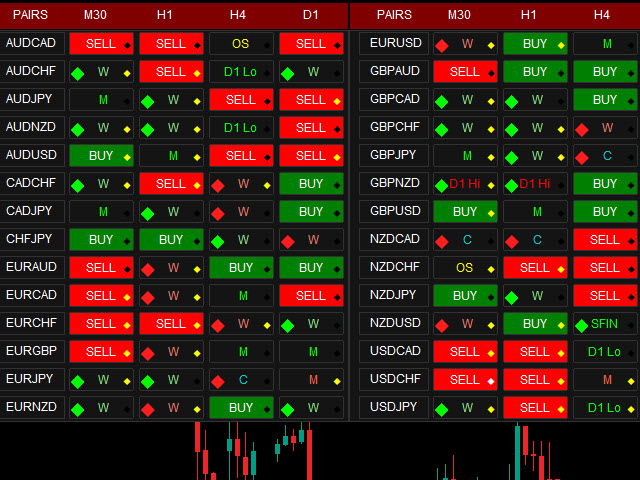
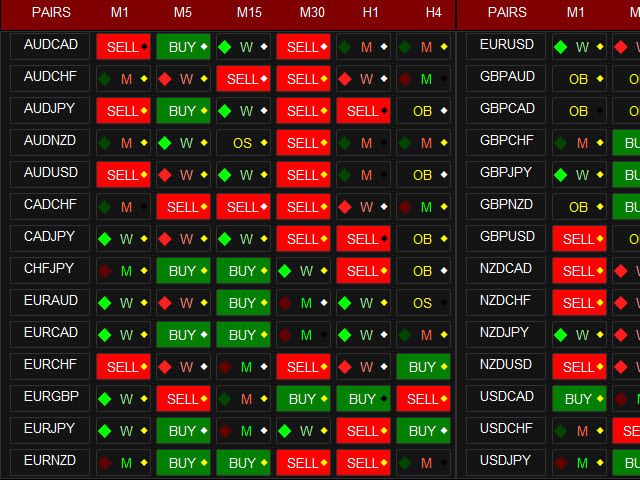
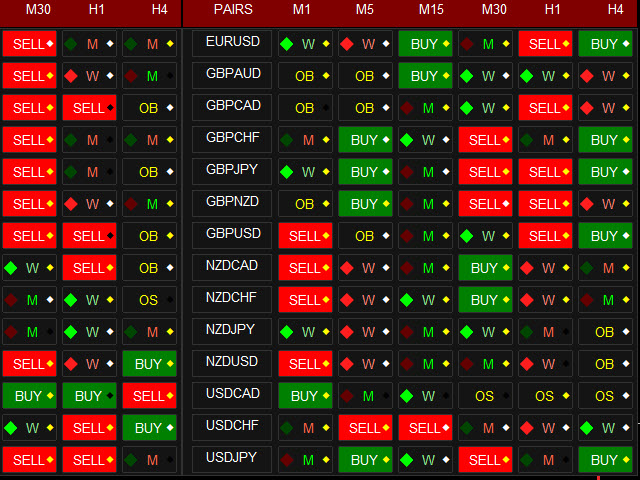
Escáner TDI Multi Timeframe:
Este indicador del Dashboard utiliza el indicador TDI (Trader's Dynamic Index) para encontrar las mejores operaciones.
Lea la Guía de Uso detallada:
https://www.mql5.com/en/blogs/post/758252
Indicadores adicionales también disponibles en el post anterior.
Comprobaciones de:
- Patrón SharkFin
Indicador gratuito para SharkFin:
https://www.mql5.com/en/market/product/42405/
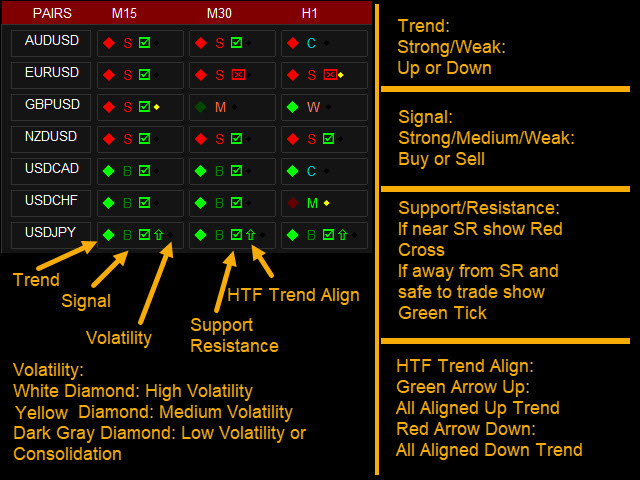
- Tendencia TDI: Tendencia fuerte/débil arriba/abajo
- Señal TDI: Fuerte/Media/Débil Señal de compra/venta
- Consolidación
- Sobrecompra/sobreventa
- Bandas de volatilidad
- Máximo/Mínimo del día/semana/mes anterior
- Si la Tendencia TDI y la Señal TDI son ambas fuertes, entonces un botón Verde o Rojo de COMPRA o VENTA.
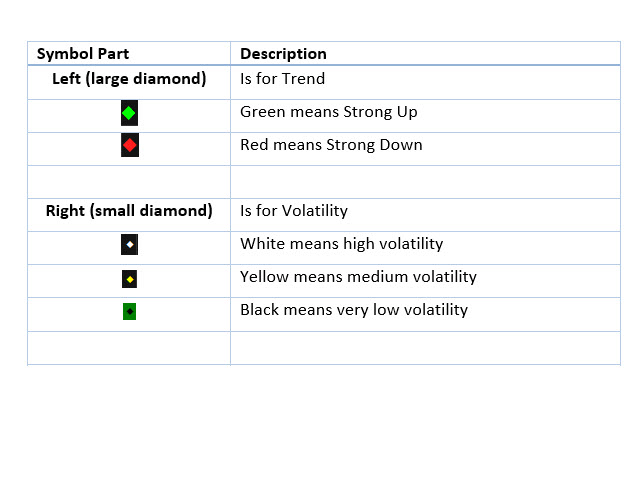
El diamante izquierdo es para la tendencia:
- El verde significa fuerte subida y el rojo fuerte bajada
- Verde oscuro significa subida débil y rojo oscuro significa bajada débil
El icono de la derecha (rombo pequeño) representa la volatilidad:
- Blanco significa alta volatilidad
- Amarillo significa volatilidad media
- El negro significa volatilidad muy baja
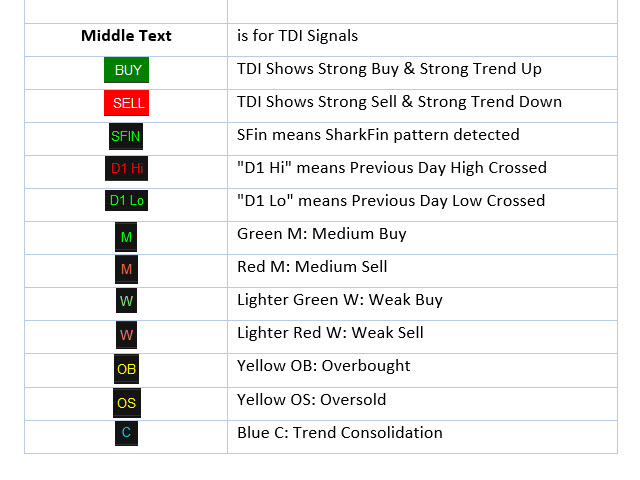
El texto central corresponde a las señales TDI:
- SFin significa patrón SharkFin detectado
- D1 Hi" o "D1 Lo" significa que se ha cruzado el máximo o el mínimo del día anterior.
- Verde B: Compra fuerte, Rojo S: Venta fuerte
- Verde MB: Compra Media y Rojo MS: Venta Media
- Verde claro WB: Compra débil y Rojo claro WS: Venta débil
- Amarillo OB: Sobrecomprado y OS: Sobrevendido
- Azul C: Consolidación de la tendencia
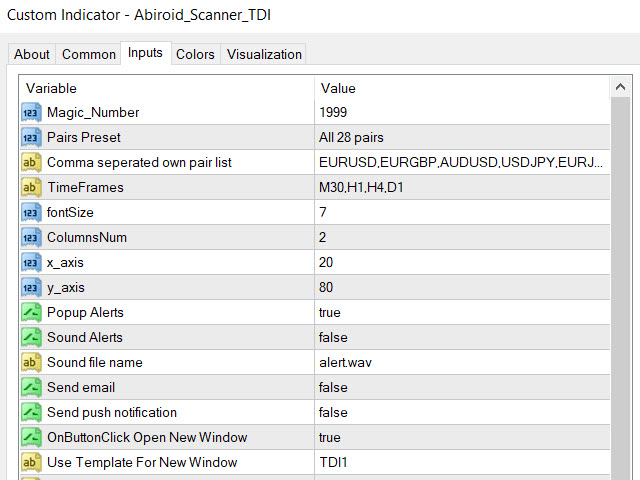
Configuración:
Ajustes detallados del tablero común:
https://www.mql5.com/en/blogs/post/747456
- Especifique sus propios pares (lista separada por comas). O seleccione una lista de pares de nuestro desplegable para pares de divisas como "Forex Core 7", "Forex Core 14", etc.
- Especifique sus propios marcos temporales preferidos en una lista separada por comas.
- Configuración para mostrar alertas: Alertas emergentes, por correo electrónico, sonoras, etc.
- Eje_x, Eje_y: para posicionar el Scanner Dashboard
- fontSize: para cambiar el tamaño de todo el panel y sus fuentes. Para una mejor experiencia utilice fontSize entre 5 y 8.
- ColumnsNum: Número de columnas del panel
- OnButtonClick Abrir Nueva Ventana: Al hacer clic en cualquier botón del cuadro de mandos, abre ese Pair-TimeFrame en una nueva ventana con la plantilla especificada (siguiente ajuste)
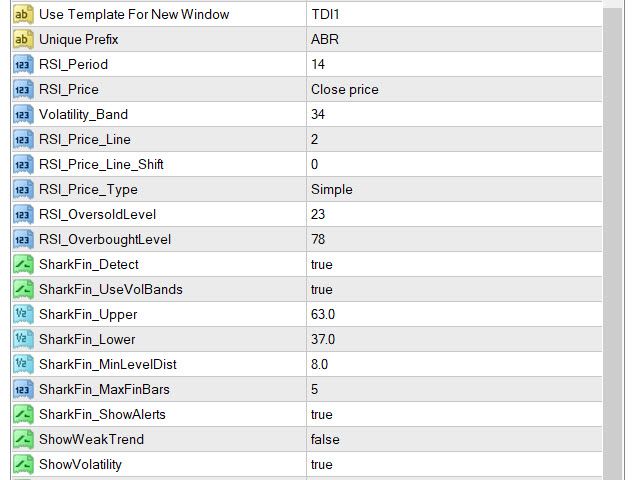
- Usar plantilla para nueva ventana: Nombre de la plantilla sin ".tpl". Ej: Cree un archivo Template1.tpl en la carpeta templates y aquí especifique: "Plantilla1".
(sólo funciona si la propiedad anterior está en true). No funciona si al pulsar el botón se establece abrir en la ventana actual porque de lo contrario podría perder los indicadores de la ventana actual o la configuración existente del dashboard.
- ShowWeakTrend: true/false Para mostrar el diamante izquierdo si la tendencia es débil o no.
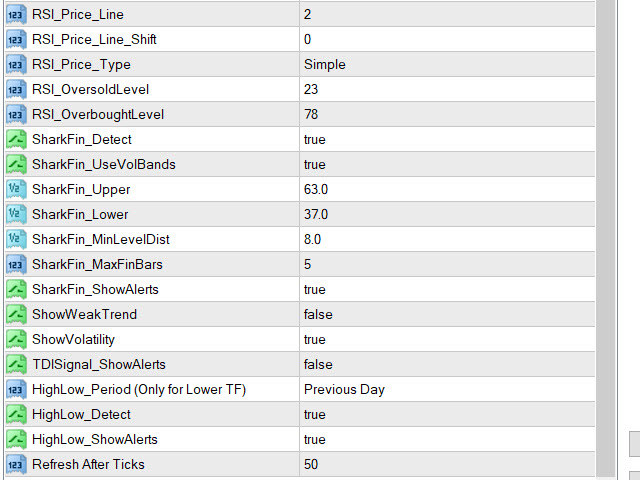
- ShowVolatility: true/false Para mostrar el diamante derecho si la volatilidad es débil o no.
- Refresh After Ticks (si shift 0): Para shift 0, espera este número de ticks antes de refrescar cada vez. Por defecto 100. Si desea que se actualice más rápido especifique un número menor.
Para un TF más alto use un número mayor como 300 o 500.
SharkFin:
- Detectar: true/false
- UseVolBands: Comprueba el cruce de bandas de volatilidad junto con el patrón SharkFin
- Niveles superiores/inferiores: Niveles RSI donde el precio cruza y vuelve para crear un SharkFin
- MinLevelDist: Distancia mínima desde el nivel superior/inferior del RSI (para que la aleta de tiburón sea válida)
- MaxFinBars: Número máximo de barras dentro de las cuales debe crearse el patrón.
Alto/Bajo:
- Detectar: true/false
- Periodo: Día/Semana/Mes anterior
Cómo operar:
La mejor manera de utilizar este indicador es con Soporte y Resistencia, Fibo u otros indicadores de apoyo. O cualquier otro indicador que podría validar que la tendencia sigue siendo fuerte y no cerca de una zona SR.
Utilice la volatilidad para comprobar la señal. No opere cuando el diamante de la volatilidad sea negro y opere con cuidado cuando esté sobrecomprado o sobrevendido.
También puedes utilizar patrones de RSI y Bandas V para operar. Por ejemplo, si se forma una "M" en el RSI ligeramente fuera de las bandas V, venda si la volatilidad es alta. O si se forma una "W", opere Comprar.
Nota importante:
- Por favor, no utilice demasiados marcos de tiempo y demasiados pares porque el escáner tendrá que escanear todos y cada uno y podría ser más lento cuantos más pares seleccione.
- Lo mejor es operar en mercados con tendencia para los marcos de tiempo más altos. Para los plazos más bajos, scalping mercados laterales también funciona bien con TDI.


Useful, thank you. A very good developer.