ON Trade Wolf Waves Patterns

This product is a part of 

ON Trade Waves Patterns Harmonic Elliot Wolfe


you can test free version on EURJPY from this link 

Wolf Waves Indicator


Discover Wolf Waves - Your Ultimate Trading Tool!

Are you on the hunt for a powerful tool to spot Wolf Waves easily on any time frame? Look no further! Our Wolf Waves indicator does the job effortlessly. Here's why it's perfect for you:

Key Features:

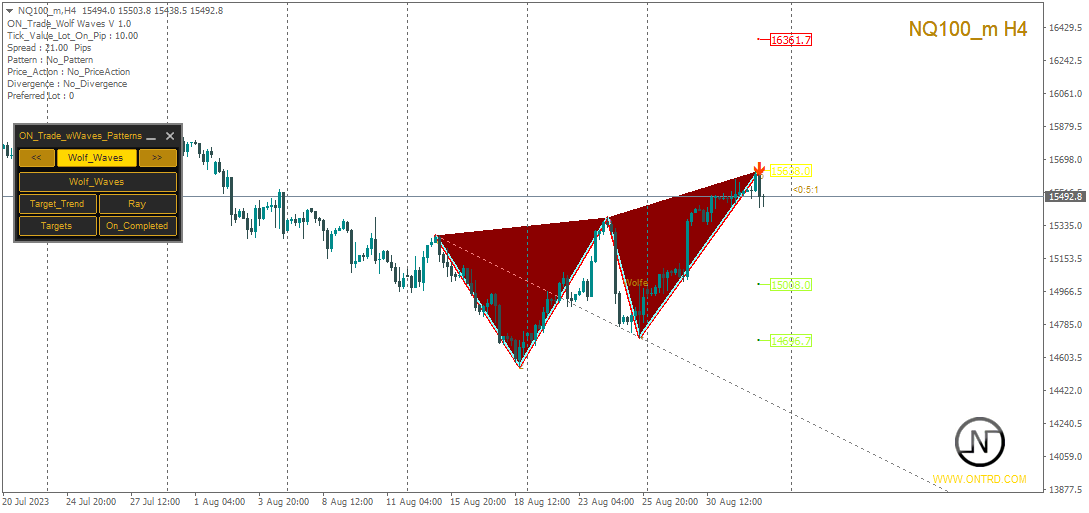
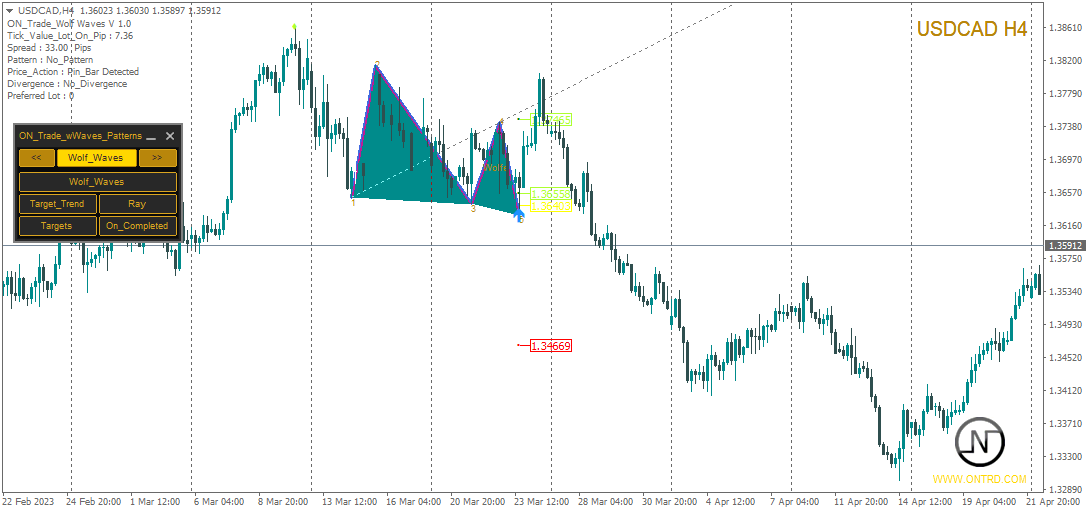
  1. Automatic Detection: Our Wolf Waves indicator finds key points and draws lines on your chart automatically. No more manual pattern searching.

  2. User-Friendly: Whether you're a pro or new to Wolf Waves, our indicator is simple to use.

  3. Accuracy: It's super precise, reducing false signals and boosting your confidence.

  4. Info-Packed: It provides entry points, stop levels, and profit targets to help you make smart trading choices.

  5. EA Ready: If you're into automated trading, this indicator seamlessly integrates with your Expert Advisor (EA).

How to Use:

  1. Spot the Pattern: When you see a Wolf Waves pattern on your chart, it's time to act. Go with the direction shown by the pattern.

  2. Hit Your Targets: Stay in the trade until the price reaches Line 1-4 or your first target point, equidistant from Point 2 to Point 1. Keep in mind, this doesn't happen every time.

Note: Wolf Waves don't appear on all timeframes or market conditions. Use this indicator wisely as part of your overall trading strategy, including risk management.

Don't miss out on the potential profits that Wolf Waves can offer. Boost your trading with our Wolf Waves indicator and gain an edge in the markets.

Ready to elevate your trading? Get started with our Wolf Waves indicator today!


Recommended products
Daily Candle Predictor is an indicator that predicts the closing price of a candle. The indicator is primarily intended for use on D1 charts. This indicator is suitable for both traditional forex trading and binary options trading. The indicator can be used as a standalone trading system, or it can act as an addition to your existing trading system. This indicator analyzes the current candle, calculating certain strength factors inside the body of the candle itself, as well as the parameters of
The SMC Venom Model BPR indicator is a professional tool for traders working within the Smart Money (SMC) concept. It automatically identifies two key patterns on the price chart: FVG (Fair Value Gap) is a combination of three candles, in which there is a gap between the first and third candles. It forms a zone between levels where there is no volume support, which often leads to a price correction. BPR (Balanced Price Range) is a combination of two FVG patterns that form a “bridge” - a zone of
MACDivergence MTF
Pavel Zamoshnikov
4.29 (7)
Advanced ideas of the popular MACD indicator: It detects and displays classic and reverse divergences (three methods of detecting divergences). It uses different color to highlight an uptrend and a downtrend. Two methods of determining a trend: а) MACD crosses the 0 level (classic signal); б) MACD crosses its own average (early signal). This is a multi-timeframe indicator: it can display MACD data from other timeframes. Two methods of drawing: classic histogram and line. It generates sound and v
TWO PAIRS SQUARE HEDGE METER INDICATOR Try this brilliant 2 pairs square indicator It draws a square wave of the relation between your two inputs symbols when square wave indicates -1 then it is very great opportunity to SELL pair1 and BUY Pair2 when square wave indicates +1 then it is very great opportunity to BUY pair1 and SELL Pair2 the inputs are : 2 pairs of symbols         then index value : i use 20 for M30 charts ( you can try other values : 40/50 for M15 , : 30 for M30 , : 10 for H1 ,
Forex Gump
Andrey Kozak
2.4 (5)
Forex Gump is a fully finished semi-automatic trading system. In the form of arrows, signals are displayed on the screen for opening and closing deals. All you need is to follow the instructions of the indicator. When the indicator shows a blue arrow, you need to open a buy order. When the indicator shows a red arrow, you need to open a sell order. Close orders when the indicator draws a yellow cross. In order to get the most effective result, we recommend using the timeframes H1, H4, D1. There
VR Cub
Vladimir Pastushak
VR Cub is an indicator for getting high-quality entry points. The indicator was developed to facilitate mathematical calculations and simplify the search for entry points into a position. The trading strategy for which the indicator was written has been proving its effectiveness for many years. The simplicity of the trading strategy is its great advantage, which allows even novice traders to successfully trade with it. VR Cub calculates position opening points and Take Profit and Stop Loss targe
Fibonacci retracement and extension line drawing tool Fibonacci retracement and extended line drawing tool for MT4 platform is suitable for traders who use  golden section trading Advantages: There is no extra line, no too long line, and it is easy to observe and find trading opportunities Trial version: https://www.mql5.com/zh/market/product/35884 Main functions: 1. Multiple groups of Fibonacci turns can be drawn directly, and the relationship between important turning points can be seen
The   Trend Duration Forecast MT4   indicator is designed to estimate the probable lifespan of a bullish or bearish trend. Using a Hull Moving Average (HMA) to detect directional shifts, it tracks the duration of each historical trend and calculates an average to forecast how long the current trend is statistically likely to continue. This allows traders to visualize both real-time trend strength and potential exhaustion zones with exceptional clarity. KEY FEATURES Dynamic Trend Detection:   Uti
Risk Management and Limit Monitoring Indicator for Professional Traders and Evaluation Accounts (Prop) This tool only displays precise risk management and limit information on the chart to help you make more focused decisions. The indicator does not open/close/modify trades and does not interfere with Expert Advisors (EAs). Features Monitoring daily and total drawdown Calculates and displays daily and total drawdown based on Balance or Equity (configurable). Shows the remaining percentage to th
We present you the indicator "Candle closing counter", which will become your indispensable assistant in the world of trading. That’s why knowing when the candle will close can help: If you like to trade using candle patterns, you will know when the candle will be closed. This indicator will allow you to check if a known pattern has formed and if there is a possibility of trading. The indicator will help you to prepare for market opening and market closure. You can set a timer to create a pre
Auto Fibo Pro m
DMITRII GRIDASOV
"Auto FIBO Pro"   Crypto_Forex  indicator  - is great auxiliary tool in trading! Indicator automatically calculate and place on chart Fibo levels and local trend lines (red color). Fibonacci levels indicate key areas where price can reverse. Most important levels are 23.6%, 38.2%, 50% and 61.8%. You can use it   for reversal scalping  or for zone grid trading. There are plenty of opportunities to  improve your current system using Auto FIBO Pro indicator as well. It has Info Spread Swap Displa
Super Reversal Pattern
Parfait Mujinga Ndalika
Super Reversal Pattern Indicator Unlock the power of advanced pattern recognition with our Super Reversal Pattern Indicator. Designed for traders seeking precision and reliability, this indicator identifies one of the most effective reversal patterns in technical analysis, offering a significant edge in your trading strategy. Key Features: Non-Repainting Accuracy: Enjoy the confidence of non-repainting technology. Once a Super Reversal Pattern is detected, it remains static, providing consiste
Our Basic Support and Resistance indicator is the solution you need to boost your technical analysis. This indicator allows you to project support and resistance levels on the chart / MT5 Version Features Integration of Fibonacci Levels:  With the option to display Fibonacci levels alongside support and resistance levels, our indicator gives you an even deeper insight into market behavior and possible reversal areas. Performance Optimization:  With the option to update extended lines only at th
PZ Harmonacci Patterns
PZ TRADING SLU
3.17 (6)
Trade smarter, not harder: Empower your trading with Harmonacci Patterns This is arguably the most complete harmonic price formation auto-recognition indicator you can find for the MetaTrader Platform. It detects 19 different patterns, takes fibonacci projections as seriously as you do, displays the Potential Reversal Zone (PRZ) and finds suitable stop-loss and take-profit levels. [ Installation Guide | Update Guide | Troubleshooting | FAQ | All Products  ] It detects 19 different harmonic pric
Royal Dutch Skunk
Sayan Vandenhout
ROYAL DUTCH SKUNK USES THE TREND WAVE INDICATOR AND IT CAN IDENTIFY THE BEGINNING AND THE END OF A NEW WAVE TREND MOVEMENT. AS AN OSCILLATOR, THE INDICATOR IDENTIFIES THE OVERBOUGHT AND OVERSOLD ZONES. IT WORKS GREAT TO CATCH THE SHORT TERM PRICE REVERSALS AND USES A MARTINGALE STRATEGY TO CLOSE ALL TRADES IN PROFIT. USE DEFAULT SETTINGS ON H1 OR HIGHER TIME FRAME ON ANY PAIR FOR MORE ACCURATE TRADES WHY THIS EA : Smart entries calculated by 6 great strategies The EA can be run on even a $20000
Based on MACD indicator waves with standard parameters Applies Fibonacci levels to the last two MACD waves, positive and negative respectively, if at the moment the MACD indicator runs out of negative Wave - the color is green, if at the moment the MACD indicator runs out of positive Wave - the color is red. The Wave termination criterion is two ticks with a different MACD sign. Applies trend lines on the last four MACD Waves. Works well with the expert Figures MACD   https://www.mql5.com/ru/mar
Gold Bricks FX USES THE TREND WAVE INDICATOR AND IT CAN IDENTIFY THE BEGINNING AND THE END OF A NEW WAVE TREND MOVEMENT. AS AN OSCILLATOR, THE INDICATOR IDENTIFIES THE OVERBOUGHT AND OVERSOLD ZONES. IT WORKS GREAT TO CATCH THE SHORT TERM PRICE REVERSALS AND USES A MARTINGALE STRATEGY TO CLOSE ALL TRADES IN PROFIT. USE DEFAULT SETTINGS ON H1 OR HIGHER TIME FRAME ON ANY PAIR FOR MORE ACCURATE TRADES WHY THIS EA : Smart entries calculated by 4 great strategies The EA can be run on even a $300
Crypto_Forex Indicator  " Morning  Star  pattern" for MT4. Indicator "Morning Star pattern" is a very powerful indicator for Price Action trading:   No repaint, No delay. Indicator   detects bullish Morning Star patterns on chart:  Blue arrow signal on chart (see pictures). With P C, Mobile & Email alerts. Also its brother - bearish  " Evening Star pattern" indicator is available (follow the link below). Indicator  " Morning Star pattern" is excellent to   combine with Support/Resistance Levels
URGENCY “Limited launch pricing” “Price increases after version 2.0” Currencies Gold Momentum Flow Dashboard  — See Market Strength Instantly A powerful all-in-one dashboard that shows real-time momentum across multiple timeframes (M5–D1) for forex and gold. Multi-timeframe ROC analysis Built-in trade signals (alignment & momentum shifts) Currency strength meter Heatmap for instant trend recognition Alerts + one-click pair switching Stop switching charts — see the entire market in
Trendiness Index
Libertas LLC
5 (3)
"The trend is your friend" is one of the best known sayings in investing, because capturing large trendy price movements can be extremely profitable. However, trading with the trend is often easier said than done, because many indicators are based on price reversals not trends. These aren't very effective at identifying trendy periods, or predicting whether trends will continue. We developed the Trendiness Index to help address this problem by indicating the strength and direction of price trend
Noize Absorption Index MT4
Ekaterina Saltykova
5 (1)
Noize Absorption Index - is the manual trading system that measures the difference of pressure between bears forces and bulls forces. Green line - is a noize free index that showing curent situation. Zero value of index shows totally choppy/flat market.Values above zero level shows how powerfull bullish wave is and values below zero measures bearish forces.Up arrow appears on bearish market when it's ready to reverse, dn arrow appears on weak bullish market, as a result of reverse expectation. S
Easy RSI divergences
Carlos Mendez Sanchez
Easy RSI Divergences – Unlock Professional-Level Divergence Trading Easy RSI Divergences is a cutting-edge indicator for MetaTrader 4, crafted for traders who want to gain a competitive edge by accurately identifying RSI (Relative Strength Index) divergences in real time. Whether you are a beginner or a professional, this tool transforms complex market signals into clear, actionable insights. The indicator automatically detects both classic divergences (indicating potential trend reversals) a
Cosmic Diviner X Planet
Olena Kondratenko
4 (2)
This unique multi-currency strategy simultaneously determines the strength of trends and market entry points, visualizing this using histograms on the chart. The indicator is optimally adapted for trading on the timeframes М5, М15, М30, Н1. For the convenience of users, the indicator renders the entry point (in the form of an arrow), recommended take profit levels (TP1, TP2 with text labels) and the recommended Stop Loss level. The take profit levels (TP1, TP2) are automatically calculated for
ZhiBiMACD MT4
Qiuyang Zheng
4.5 (2)
This is a unique MACD indicator that is more accurate and easy to use than traditional MACD. It is suitable for any chart cycle and is suitable for any market variety. The red column is the (Buy) band signal, and the blue column is the (Sell) band signal. The yellow and green lines are trend lines, and the two lines never cross. Buy: In the blue column, look at the green line up through the middle 0 axis. Sell: In the red column, look at the yellow line down the middle 0 axis. The MACD's de
Quantum Balance
Adolfina Denysenko
Quantum Balance is a modern arrow indicator that identifies key price reversal points in the market with high accuracy. It is based on a combination of WPR (Williams %R) and RSI (Relative Strength Index), which allows you to identify overbought/oversold moments and enter trades at points of maximum potential. The indicator analyzes price dynamics and market conditions, generating signals only when several confirming factors coincide. This reduces the number of false signals and increases tradin
Infinity Trend Pro
Yaroslav Varankin
1 (1)
This is a trend indicator without redrawing Developed instead of the binary options strategy (by the color of the Martingale candlestick) Also works well in forex trading When to open trades (binary options) A signal will appear in the place with a candle signaling the current candle It is recommended to open a deal for one candle of the current timeframe M1 and M5 When a blue dot appears, open a deal up When a red dot appears, open a trade down. How to open trades on Forex. When a signal is rec
Automatically plots Fibo levels, based on the High & Low prices from the specified time frame Multiple bars may be united: e.g. you can get a Fibo based on the 10-days Highs and Lows My   #1 Utility : 65+ features, including this indicator  |   Contact me  for any questions  |  MT5 version Helps to see potential reversal levels; Patterns formed at the Fibo levels tend to be stronger; Significantly reduces the time spent on manual  plotting ; Settings: Timeframe to calculate the base High & Low p
This is a new strategy for SUPPLY DEMAND areas It is based on a calculation using the tick volume to detect the big price action in market for both bear /bull actions this smart volume action candles are used to determine the supply and demand areas prices in between main supply and demand lines indicate sideway market  up arrows will be shown when prices moves above the main supply and the secondary supply lines Down arrows will be shown when prices moves below the main demand and the secondary
All Symbols   AND  All Time frames Scan                                                                                                                 Document Introduction   The ABCD is a basic harmonic pattern. The ABCD pattern is a visual, geometric chart pattern comprised of three consecutive price swings. It looks like a diagonal lightning bolt and can indicate an upcoming trading opportu
MACD Trend Break
Manoj Kumar Sharma
MACD oscillator with advanced trend filtering and Alert indication. It determines the trend, weak trends are filtered out and New strength in the trend in indicated. MACD Oscillator works on any timeframes and on all symbol (currencies, indices, oil, metals, stocks, options, offline renko charts) 1. User can change MACD value, 2. Minimum MACD level filter, 3. Divide value will filter out the power ratio with which trend change indication is needed on any chart. 4. Buffer value will have addition
Buyers of this product also purchase
Gann Made Easy
Oleg Rodin
4.83 (162)
Gann Made Easy is a professional and easy to use Forex trading system which is based on the best principles of trading using the theory of W.D. Gann. The indicator provides accurate BUY and SELL signals including Stop Loss and Take Profit levels. You can trade even on the go using PUSH notifications. PLEASE CONTACT ME AFTER PURCHASE TO GET TRADING  INSTRUCTIONS AND GREAT EXTRA INDICATORS   FOR FREE! Probably you already heard about the Gann trading methods before. Usually the Gann theory is a ve
Scalper Inside PRO
Alexey Minkov
4.74 (69)
Scalper Inside PRO – Since 2020. An exclusive indicator that utilizes an innovative algorithm to swiftly and accurately determine the market trend. The indicator automatically calculates opening, closing, and profit levels, providing detailed trading statistics. With these features, you can choose the most appropriate trading instrument for the current market conditions. Additionally, you can easily integrate your own arrow indicators into Scalper Inside Pro to quickly evaluate their statistics
M1 Sniper
Oleg Rodin
5 (22)
M1 SNIPER is an easy to use trading indicator system. It is an arrow indicator which is designed for M1 time frame. The indicator can be used as a standalone system for scalping on M1 time frame and it can be used as a part of your existing trading system. Though this trading system was designed specifically for trading on M1, it still can be used with other time frames too. Originally I designed this method for trading XAUUSD and BTCUSD. But I find this method helpful in trading other markets a
Market Makers
Mohamed Hassan
5 (4)
After purchase, contact me privately to receive 1 month of free testing with EA Forex Proton! This advanced MT4 trading robot automatically executes signals from any MT4 indicator, including Market Makers. The latest version also includes AI integration, allowing each trade signal to be analyzed using Artificial Intelligence. Live Signal with EA Forex Proton: Click here Market Makers is a powerful price action trading system designed to identify high-probability Buy and Sell opportunities based
GoldRush Trend Arrow Signal V1.6 The GoldRush Trend Arrow Signal indicator V1.6 continues to provide precise, real-time trend analysis tailored for high-speed, short-term scalpers in XAU/USD , but it now has additional features and improved efficiency and reliability. Built specifically for the 1-minute time frame, this tool displays directional arrows for clear entry points, allowing scalpers to navigate volatile market conditions with confidence. The indicator consists of PRIMARY and SECONDARY
PRO Renko System
Oleg Rodin
5 (30)
PRO Renko System is a highly accurate trading system specially designed for trading RENKO charts. The ARROWS and Trend Indicators DO NOT REPAINT! The system effectively neutralizes so called market noise giving you access to accurate reversal signals. The indicator is very easy to use and has only one parameter responsible for signal generation. You can easily adapt the tool to any trading instrument of your choice and the size of the renko bar. I am always ready to provide extra support to help
Technical indicator that structures charts and identifies cyclical price movements. Can work on any charts. Several types of alerts. There are additional arrows on the chart itself. Without redrawing on history, works on closing a candle. Recommended TF from M5 and higher. Easy to use and configure parameters. When using 2 indicators with different parameters, you can use without other indicators. Has 2 input parameters Cyclicality and Signal duration These 2 parameters work with the processin
NAM Divergences
NAM TECH GROUP, CORP.
5 (1)
MT4 Multi-timeframe Divergence and Overbougt/Oversold detection indicator. Features - Fully customizable on chart control panel, provides complete interaction. - Hide and show control panel wherever you want. - Real time information about non-capitalized divergences. - Real time information about overbougt / oversold situations. - Real time information about regular divergences. - Real time information about hidden divergences. - Oscillators available for divergences detection: AO, RSI, CCI, MA
Advanced Supply Demand
Bernhard Schweigert
4.91 (300)
Trading Special – 40% OFF Best Solution for any Newbie or Expert Trader! This indicator is a unique, high quality and affordable trading tool because we have incorporated a number of proprietary features and a new formula. With this update, you will be able to show double timeframe zones. You will not only be able to show a higher TF but to show both, the chart TF, PLUS the higher TF: SHOWING NESTED ZONES. All Supply Demand traders will love it. :) Important Information Revealed Maximize the pot
Trading Special – 40% OFF Best Solution for any Newbie or Expert Trader! This indicator is a unique, high quality and affordable trading tool because we have incorporated a number of proprietary features and a secret formula. With only ONE chart it gives Alerts for all 28 currency pairs. Imagine how your trading will improve because you are able to pinpoint the exact trigger point of a new trend or scalping opportunity! Built on new underlying algorithms it makes it even easier to identify and c
Auto Optimized Parabolic RSI: Advanced 3D Momentum Engine Most retail indicators fail because they rely on static inputs that break the moment market volatility shifts. Auto Optimized Parabolic RSI solves the problem of "indicator decay" by continuously recalculating its own mathematical edge, bringing institutional-grade quantitative adaptation directly to your MT5 terminal. The Core Advantage: Custom In-Memory 3D Optimization   Standard auto-optimizers often freeze the MT5 platform because the
Apollo SR Master is a Support/Resistance indicator with special features which make trading with Support/Resistance zones easier and more reliable. The indicator calculates Support/Resistance zones in real-time without any time lag by detecting local price tops and bottoms. Then to confirm the newly formed SR area, the indicator shows special signal which signalizes that the SR zone can be taken into consideration and used as an actual SELL or BUY signal. In this case the strength of the SR zone
Trading Special –40% OFF Best Solution for any Newbie or Expert Trader! This Indicator is a unique, high quality and affordable trading tool because we have incorporated a number of proprietary features and a new formula. With only ONE chart you can read Currency Strength for 28 Forex pairs! Imagine how your trading will improve because you are able to pinpoint the exact trigger point of a new trend or scalping opportunity? User manual: click here That's the first one, the original! Don't buy a
The " Dynamic Scalper System " indicator is designed for the scalping method of trading within trend waves. Tested on major currency pairs and gold, compatibility with other trading instruments is possible. Provides signals for short-term opening of positions along the trend with additional price movement support. The principle of the indicator. Large arrows determine the trend direction. An algorithm for generating signals for scalping in the form of small arrows operates within trend waves.
Atomic Analyst
Issam Kassas
5 (5)
First of all Its worth emphasizing here that this Trading Indicator is   Non-Repainting , Non Redrawing and Non Lagging Indicator   Indicator, Which makes it ideal from both manual and robot trading.  User manual: settings, inputs and strategy . The Atomic Analyst  is a PA Price Action Indicator that uses Strength and Momentum of the price to find a better edge in the market. Equipped with Advanced filters which help remove noises and false signals, and Increase Trading Potential. Using Multiple
Trend Screener
STE S.S.COMPANY
4.79 (95)
Trend Screener Indicator --Professional Trend Trading & Market Scanning System for MetaTrader Unlock the true power of trend trading with Trend Screener Indicator — a complete multi-currency, multi-timeframe trend analysis solution   powered by Fuzzy Logic,Trend Pulse Technology  and advanced market structure algorithms.   Trend Screener transforms your MetaTrader platform into a professional-grade Trend Analyzer and Market Scanner, helping you identify high-probability trend opportunities, ear
Currency Strength Wizard is a very powerful indicator that provides you with all-in-one solution for successful trading. The indicator calculates the power of this or that forex pair using the data of all currencies on multiple time frames. This data is represented in a form of easy to use currency index and currency power lines which you can use to see the power of this or that currency. All you need is attach the indicator to the chart you want to trade and the indicator will show you real str
Scalping Lines System - is a scalping trading system specifically designed for trading the Gold, XAUUSD asset on M1-H1 timeframes. It combines indicators for trend, volatility, and overbought/oversold market analysis, gathered into a single oscillator for identifying short-term signals. The main internal parameters for the signal lines are pre-configured. Some parameters remain for manual adjustment: "Trend Wave Duration," which regulates the duration of a series of signals in the trend directi
The Seismograph Marketquake Detector . No matter way you trade, you definitely want to avoid entry in the low liquidity market. - The seismograph will help you the right time to enter the market before market rally. However, even though you have made sure to entry at market times that should be busy, the fact is that many people are often trapped in markets with low liquidity. After several hours of waiting, the market suddenly became busy, but... it turned out that many people were now in the
Supply and Demand Dashboard PRO
Bernhard Schweigert
4.8 (20)
Trading Special – 40% OFF This dashboard is a very powerful piece of software working on multiple symbols and up to 9 timeframes. It is based on our main indicator (Best reviews:   Advanced Supply Demand ). The dashboard gives a great overview. It shows: Filtered Supply and Demand values including zone strength rating, Pips distances to/and within zones, It highlights nested zones, It gives 4 kind of alerts for the chosen symbols in all (9) time-frames. It is highly configurable for your pers
Super Signal – Skyblade Edition Professional No-Repaint / No-Lag Trend Signal System with Exceptional Win Rate | For MT4 / MT5 It works best on lower timeframes, such as 1-minute, 5-minute, and 15-minute charts. Core Features: Super Signal – Skyblade Edition is a smart signal system designed specifically for trend trading. It applies a multi-layered confirmation mechanism to detect only strong, directional moves supported by real momentum. This system does not attempt to predict tops or bottoms
Legacy of Gann
Pavel Zamoshnikov
4.83 (12)
The indicator very accurately determines the levels of the possible end of the trend and profit fixing. The method of determining levels is based on the ideas of W.D.Gann, using an algorithm developed by his follower Kirill Borovsky. Extremely high reliability of reaching levels (according to K. Borovsky  - 80-90%) Indispensable for any trading strategy – every trader needs to determine the exit point from the market! Precisely determines targets on any timeframes and any instruments (forex, met
FX Volume
Daniel Stein
4.63 (38)
FX Volume: Experience Genuine Market Sentiment from a Broker’s Perspective Quick Overview Looking to elevate your trading approach? FX Volume provides real-time insights into how retail traders and brokers are positioned—long before delayed reports like the COT. Whether you’re aiming for consistent gains or simply want a deeper edge in the markets, FX Volume helps you spot major imbalances, confirm breakouts, and refine your risk management. Get started now and see how genuine volume data can
Documentation for connecting Metatrader 4 with Python with a simple drag and drop EA.   A full end-to-end solution ,fully tested ,fast and efficient! The Pytrader ecosystem consists of a python script and a MT4 EA. (  MT5  version ) Further for the licensing an indicator is used.  The communication between the python script and the EA is based on sockets. EA is the  Server   and the python script the  Client .  It is always query(function / python script) and output(data / server). The EA doe
Full Scalping Signal
Leandro Bernardez Camero
FullScalping is a non-repainting, non-backpainting indicator, specially designed to generate CONSTANT scalping entries in any market. Perfect for aggressive traders looking for nonstop action! Join the channel to stay updated with exclusive information and updates: https://www.mql5.com/en/channels/forexnewadvisor You’ll notice it gives signals on almost every candle , either confirming the trend or signaling key retracements. It’s like having a radar constantly guiding you. How does it work?
Stop Guessing. Start Trading with a Statistical Edge. Stock indices don't trade like forex. They have defined sessions, they gap overnight, and they follow predictable statistical patterns. This indicator gives you the probability data you need to trade indices like the DAX, S&P 500, and Dow Jones with confidence. What Makes This Different Most indicators show you what happened. This one shows you what's likely to happen next.  Every trading day, the indicator analyses your current setup against
Volatility Trend System - a trading system that gives signals for entries. The volatility system gives linear and point signals in the direction of the trend, as well as signals to exit it, without redrawing and delays. The trend indicator monitors the direction of the medium-term trend, shows the direction and its change. The signal indicator is based on changes in volatility and shows market entries. The indicator is equipped with several types of alerts. Can be applied to various trading ins
Trend indicator AI
Ramil Minniakhmetov
4.54 (84)
Trend Ai indicator is great tool that will enhance a trader’s market analysis by combining trend identification with actionable entry points and reversal alerts.  This indicator empowers users to navigate the complexities of the forex market with confidence and precision Beyond the primary signals, Trend Ai indicator identifies secondary entry points that arise during pullbacks or retracements, enabling traders to capitalize on price corrections within the established trend. Important Advantage
Trend Sniper Super Indicator is one of the best indicator which can provide you will perfect signals for short term and long term trades. This indicator is suitable for both scalping and swing trading strategies. The indicator is over 85% accurate. It uses terminal Message Alerts, Emails and Push notifications to your mobile device to inform you about the new trading opportunities and it will calculate the take profit and stop loss level for you. All you will need to do is to place a trade. Subs
KT Alpha Hunter Arrows MT4
KEENBASE SOFTWARE SOLUTIONS
Most arrow indicators give you a signal and leave you to figure out the rest. KT Alpha Hunter Arrows gives you the full trading plan. Every signal arrow prints with a full plan already drawn: entry line, stop-loss, four take-profit levels, and a live edge verdict telling you whether this symbol and time-frame is worth trading right now. An included Trade Manager EA handles the execution after you enter, so discipline stays intact when the market gets loud. Non-repaint. Closed-bar signals only. B
More from author
Introducing ON Trade Waves Patterns Harmonic Elliot Wolfe, an advanced indicator designed to detect various market patterns using both manual and automated methods. Here's how it works: Harmonic Patterns: This indicator can identify harmonic patterns that appear on your chart. These patterns are essential for traders practicing harmonic trading theory, as popularized by Scott Carney's book "Harmonic Trading vol 1&2." Whether you draw them manually or rely on automated detection, ON Trade Waves
Gann Squares Indicator: Analyzing Markets with Geometric Patterns The Gann Squares indicator is a powerful tool for market analysis that draws upon the mathematical concepts introduced by W.D. Gann in his article on "Mathematical Formula for Market Predictions." This indicator incorporates Gann's techniques involving square numbers such as 144, 90, and 52, as well as the Square of 9. Additionally, it incorporates  method for utilizing the Square of 9 in conjunction with channels and the star pa
This is an astronomy indicator for the MT4 / MT5 platform like optuma program that performs a variety of functions. It uses complex algorithms to perform its own calculations, which are so accurate. The indicator has a panel that provides astronomical information such as planets' geo/heliocentric cords, distance of sun/earth, magnitude, elongation, constellation, ecliptic cords, equatorial cords, and horizontal cords depending on  the vertical line that generated by the indicator depend on the t
"This indicator is a simple trend detection tool. You can use it with your strategy to achieve good entries, such as in scalping mode. It will draw a channel around the price, which will expand as time increases. In custom periods, it will revert to the starting point of the expansion based on an algorithm that considers time and price together. You can buy at the lower boundary of the channel after signs of reversal become apparent. And you can sell from the upper boundary of the channel after
Indicator Description: The Bystra pattern indicator is designed to help traders identify trading opportunities using the Bystra pattern theory. The indicator provides entry values for placing limit orders, along with target and stop levels. This helps traders calculate their risk percentage, which is an essential aspect of proper money management in trading. Indicator Features: Use System Visuals: This option enables or disables the visual theme of the indicator, allowing users to customize its
Introducing the Gold Gram Price Calculator Indicator Are you interested in keeping a close eye on the price of gold in your local currency? Look no further than the Gold Gram Price Calculator Indicator, an innovative tool that empowers you with the ability to calculate the real-time price of gold per gram in your preferred local currency. With this indicator, you can harness the power of financial insights to make informed decisions. Key Features: Localized Gold Price: The Gold Gram Price Calcul
FREE
This indicator serves the purpose of visually representing the Donchian channel on your trading chart. The Donchian channel is a straightforward technical tool used to depict the range between the highest high and the lowest low over a specified period. This indicator enhances the visual analysis of price movements, offering insights into potential breakout and trend continuation points. The Donchian channel can be applied to both the current time frame and a higher time frame, should you choose
FREE
ON Trade Pivoteer
Abdullah Alrai
4 (1)
Introducing the Pivot Point Selector Indicator: Your Ultimate Tool for Custom Pivot Levels Are you ready to take your trading to the next level? Say hello to the Pivot Point Selector Indicator, a game-changing tool that puts you in control of your pivot levels. This innovative indicator empowers you to choose three specific points that will determine the pivot level calculations, giving you unparalleled customization and precision in your trading strategy. Key Features and Benefits: Custom Pivo
FREE
ON Trade Pivots is A technical indicator that Draws all Pivot levels depending on time frame that defined in settings. Notes It will be good tool for all traders who use pivot levels in their trades. Let me inform you that this indicator draw this level as buffers not as objects then you can connect it easily to EA. This indicator allow you to find pivots levels for any time frame not only daily you are free to choose time frame from settings. Parameters Use_System_Visuals - Enable /Disable Sy
FREE
This indicator has been designed to integrate with the Elliott Wave theory, providing two distinct methods of operation: Automatic Work: In this mode, the indicator operates autonomously by detecting all five motive waves on the chart according to Elliott Wave theory. It offers predictions and identifies potential reversal zones. Additionally, it has the capability to generate alerts and push messages to notify traders of significant developments. This automated functionality streamlines the pro
This indicator offers a robust market analysis method centered around the concept of the 'Regression Channel Tool'. By harnessing this tool, traders can gain exceptional control over their chart's regression channel, enabling them to make more informed trading decisions. The Regression Channel Tool is a powerful instrument in a trader's toolkit. It's designed to provide valuable insights into price trends and potential support and resistance levels. The tool is especially effective for visualizi
Introducing our powerful Forex indicator designed to enhance your trading strategy and provide you with precise insights into the market trends. This cutting-edge tool employs a sophisticated custom algorithm that meticulously analyzes candle measurements, making adjustments for optimal accuracy. The result? A set of arrows expertly plotted on your chart, indicating strategic entry points. The genius behind this indicator lies in its ability to harness the power of candlestick patterns and comb
The indicator is designed to detect and visualize diamond Gann waves, a specific pattern derived from Gann theory. It provides traders with insights into potential market reversals by drawing points (P) based on the ABC points of the pattern. Additionally, the indicator draws vertical lines from the predicted points (P) to help traders identify potential reversal points more easily. Indicator Features: Use_System_Visuals: This parameter enables or disables the usage of the system's visual theme
The "Fibo Star" indicator is designed to visualize Fibonacci Fans in a star-like pattern on your trading chart. These Fibonacci fans are a powerful tool for analyzing price movements and can offer insights into potential support and resistance levels. This indicator comes equipped with a user-friendly control panel, aiming to simplify the process of drawing and configuring the fans, thus saving you time and effort. Usage Instructions: This indicator is meant for manual usage. To effectively util
The "Currency Strength Indicator" is a powerful tool designed to provide traders with insights into the relative strength of various currencies in the forex market. By calculating and plotting the strength of each currency based on its corresponding time frame, this indicator offers traders the opportunity to identify potential trading opportunities, especially when there are significant divergences or crossovers observed. Key Features of the Indicator: 1. Currency Strength Calculation: The ind
Download user manual from : https://ontrd.com/our-books/ MT5 Version : https://www.mql5.com/en/market/product/30284 Gann Squares Indicator: Analyzing Markets with Geometric Patterns The Gann Squares indicator is a powerful tool for market analysis that draws upon the mathematical concepts introduced by W.D. Gann in his article on "Mathematical Formula for Market Predictions." This indicator incorporates Gann's techniques involving square numbers such as 144, 90, and 52, as well as the Square of
Harmonic Patterns Indicator: Enhancing Harmonic Trading Analysis The Harmonic Patterns Indicator is a powerful tool designed to identify harmonic patterns on your trading chart using both manual and automatic detection methods. Main Features and Functions: Manual and Automatic Detection: This indicator empowers you to identify harmonic patterns through both manual and automatic methods. Whether you draw the patterns yourself or let the indicator do it for you, it's a versatile tool to enhance y
The Hikkake Japanese candle pattern is a specialized indicator designed to identify and detect Hikkake Price Action Patterns that are being formed on a chart. These patterns are based on the concept of a false inside bar break out, which often leads to potential trading opportunities. The indicator's main function is to analyze the last five candles on the chart and determine whether they exhibit the characteristics of the Hikkake pattern. When this pattern is confirmed, the indicator will draw
Technical Indicator for Detecting Strong Price Action Patterns: Pin Bar, Inside Bar, and Outside Bar Introduction: In the realm of technical analysis, price action patterns serve as vital indicators of potential market movements. We've developed a sophisticated technical indicator that streamlines the identification of robust price action patterns on charts. Our indicator specializes in detecting three essential patterns: Pin Bar, Inside Bar, and Outside Bar. Key Patterns Detected: Pin Bar: The
Numerology-Based Support and Resistance Indicator for MetaTrader Introduction: Unlock a new dimension in technical analysis with our Numerology-Based Support and Resistance Indicator for MetaTrader. This unique tool leverages the power of numerology to identify key support and resistance levels on your charts, providing you with valuable insights into potential price movements. Key Concepts: Numerology in Trading: Numerology is the mystical study of numbers and their significance in our lives. A
Introducing Shepherd Numerology Levels Indicator: Unlock the Hidden Patterns of Price Movement Discover a revolutionary approach to trading with the Shepherd Numerology Levels Indicator. This innovative tool combines the ancient wisdom of numerology with cutting-edge trading techniques to help you identify key support and resistance levels on your charts. By harnessing the power of the Square of Nine method, this indicator offers a unique perspective on market dynamics, allowing you to make mor
Introducing the ON Trade Numerology Mirror Indicator: Unveiling Reversal Patterns through Numerology Unlock a new dimension in technical analysis with the ON Trade Numerology Mirror Indicator. This innovative tool leverages the ancient wisdom of numerology to identify key price reversal levels on your charts. By rearranging numbers in reversed positions, this indicator reveals hidden patterns that have the potential to signal significant price reversals, giving you a unique edge in your trading
ON Trade Optuma Astro
Abdullah Alrai
5 (5)
This is an astronomy indicator for the MT4 platform like optuma program that performs a variety of functions. It uses complex algorithms to perform its own calculations, which are so accurate. The indicator has a panel that provides astronomical information such as planets' geo/heliocentric cords, distance of sun/earth, magnitude, elongation, constellation, ecliptic cords, equatorial cords, and horizontal cords depending on  the vertical line that generated by the indicator depend on the time va
Introducing the ON Trade Melad Pattern Indicator: Enhance Your Trading Strategy with Breakout Patterns Discover the power of the ON Trade Melad Pattern Indicator—an intuitive tool designed to elevate your trading decisions by detecting and highlighting breakout patterns on your charts. This indicator is your key to identifying crucial breakout points and potential trend shifts with simplicity and precision. Key Features: Breakout Pattern Detection: The ON Trade Melad Pattern Indicator focuse
This indicator will give you entries as result of scalping strategy that will be applied on 14 symbols in same time and you are able to be notified with this entries  Note :   This indicator for scalping on 5 minutes timeframe only . How to use it : 1-Open chart and adjust settings (edit symbols names as your platform names , activate the alert system if you need it . 2-Wait for any signal you have it from this scanner you will have it as alert and as notification and you will see it on board
This indicator gives you the signal of real cross on stochastic indicator. This indicator is easy to attach to an ea. This indicator will work best on All time frames. Arrow appears depending on many algorithms that study the cross parameters. Indicator properties Use_System_Visuals: enable/disable visual styles. Stochastic_K_Period. Stochastic_D_Period. Stochastic_Slowing. Use_Notifications: enable/disable Push Notifications. Use_Alert: enable/disable Alerts. Use_E_Mail: enable/disable Email n
ON Trade VSA
Abdullah Alrai
Introducing "ON Trade VSA" - Your Ultimate VSA Analysis Tool! Unlock the power of Volume Spread Analysis (VSA) with our cutting-edge indicator - "ON Trade VSA." VSA is a powerful methodology used by traders to gauge market strength, identify trends, and make informed decisions. Let's dive into the key features that make "ON Trade VSA" a must-have tool for your trading arsenal: Multicolored Volume Candles : Gain insight into market dynamics with our unique feature that assigns different colors to
This program serves as an effective tool for sending messages through a Telegram bot using the MetaTrader platform. It enables you to send your trading recommendations related to the orders you open on the trading platform directly to your Telegram channel or group. These messages may include details about open trades and can be accompanied by illustrative images of the orders. Alternatively, they can be configured to be without images based on your preferences. This means that if you are the ow
Introducing our new indicator: [ON Trade Breakout Zone] Simple Yet Powerful Market Analysis Tool for All Traders! Suitable for Both Professionals and Beginner Traders Are you ready to supercharge your trading strategy? Our latest indicator is designed to simplify market analysis and empower traders of all levels. Whether you're a seasoned pro or just starting, [ ON Trade Breakout Zone ] is your key to unlocking potential profits in the market. How to Use [ ON Trade Breakout Zone ]:
User Manual Download link: https://ontrd.com/our-books/ For all who are asking about indicator  ON Trade Numerology Station It obtain about 16 numerology strategies it make together completed unit control your trading . Basic strategies to work with it are 3 strategies statistics about them are the following : 1. RBA levels success rate more then 95%. 2. FF more then 96%  3.RBA SUN 98% We will not say 100 % as they are .. Ratio rates as following :  1.Rba levels more then 1/3 to 1/6 . 2.FF MORE
Filter:
No reviews
Reply to review