ToolBox 360 MT4
- Indicators
- Version: 2.65
- Updated: 14 September 2021
- Activations: 5
Main features:
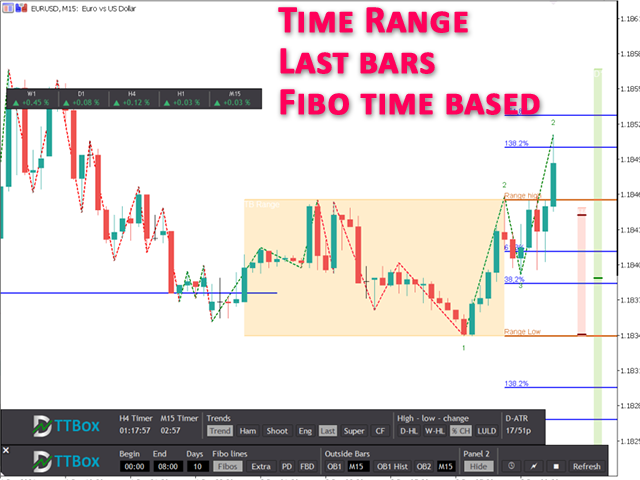
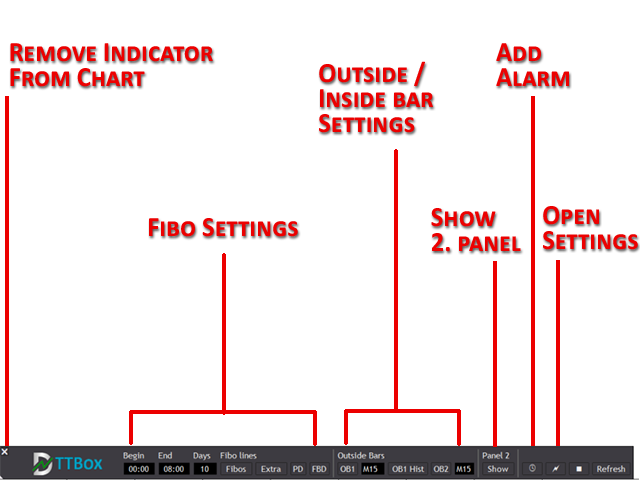
Choose a start and end time and the indicator shows you Fibonacci lines within the selected time range including range high and range low – best for range trading.
Previous day Fibonacci lines
See important Fibonacci levels based on the previous day with just one click. Within Intraday trading those Fibonacci levels are often used to identify possible price reversal points.
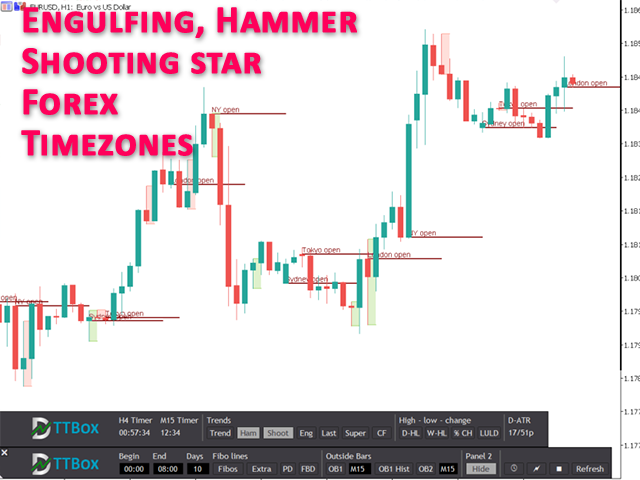
See when markets are opened or closed. This is very useful in Forex markets because you can see very easily how which session was traded.
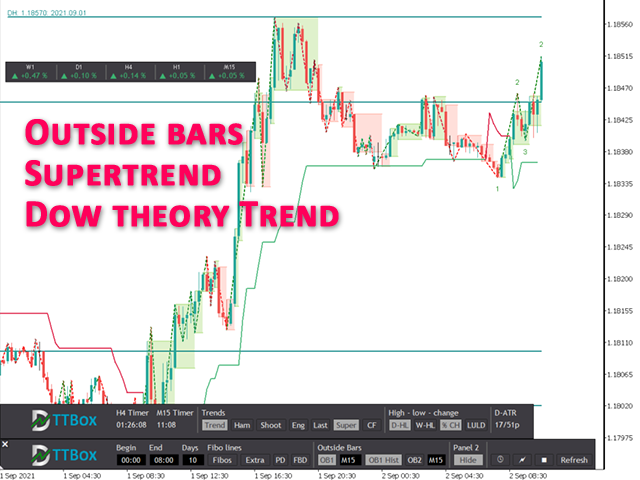
Outside bars are very important in professional price action trading. Highs and lows of outside bars can be used as entry and exit points as well as support and resistance points. With ToolBox 360 it is very easy to spot and react to those outside bars. It draws lines and rectangles of outside bars from current and higher time frames right onto the chart. No switching between time frames needed, so you will never miss an opportunity to open a good trade.
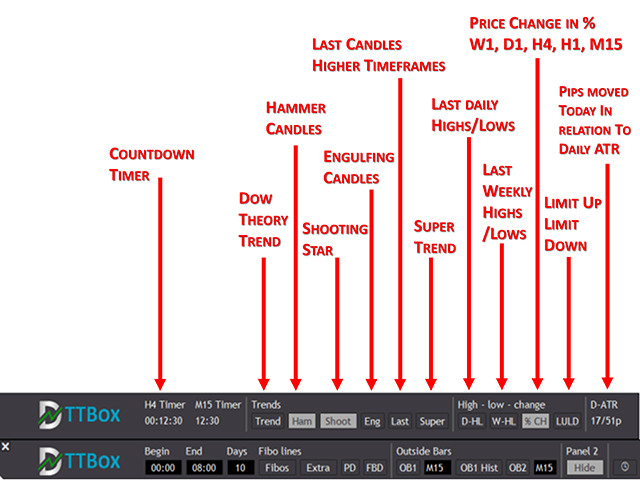
Engulfing, hammer or shooting star candles are very important because often they are forerunner of trend change or reversal. With ToolBox 360 it is very easy to spot and react to those engulfing bars because it instantly draws a rectangle around the engulfing candle.
Price action trend lines
Price action trendlines based on Dow theory. So if you are in an upward or down trend. It shows the real market trend and not just a simple ZickZag.
Supertrend
Supertrend is a very powerful and useful trend indicator to spot trend phases. It is very popular because of its clean and easy to understand principle. Prices above the trendline indicate an uptrend and prices below the trendline indicate a downtrend.
Daily highs / daily lows
With help of ToolBox 360 it is very easy to show previous daily highs und daily lows. Daily highs / lows are very important if you use price action trading because very often stops (buy stops, sell stops) are placed on this price points. This means those points are tested and price reversals ca be expected.
Weekly high / weekly low
Like daily highs / lows weekly high, weekly lows are also important for price action trading. Those points act as support or resistance levels very often. In combination with other indications this could be a very good point to open a trade and place a stop loss or a take profit.
Multi timeframe time
ToolBox 360 gives you 2 flexible count down timer. For example it can show when the next hour or 4-hour candle closes. Just select the timeframe in the settings and you are good to got. And the best, it does not matter which time frame you are actually in. It shows the count down time from your chart time frame independently.
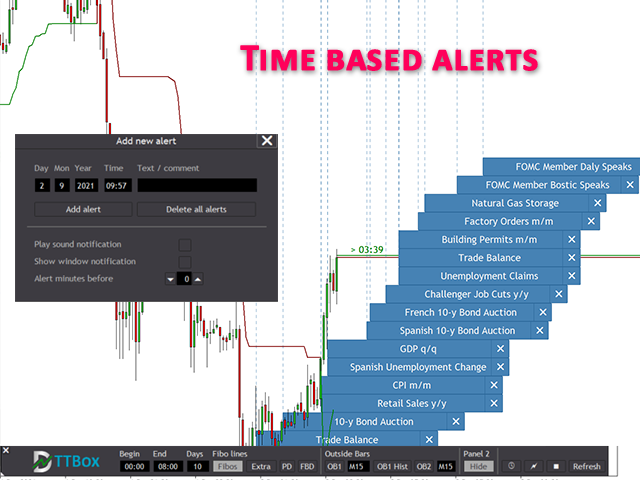
Alerts / news notifications
Create own time based alerts and place it right into the chart. When an alert is placed you get visual and acoustic notifications before an event is happening. Never miss important market events again
Symbol performance in %
See at a glance how the market has performed during the last periods. It helps you to decide or see if the asset is bullish or bearish or you can trade two correlated assets and find the weaker and stronger ones.
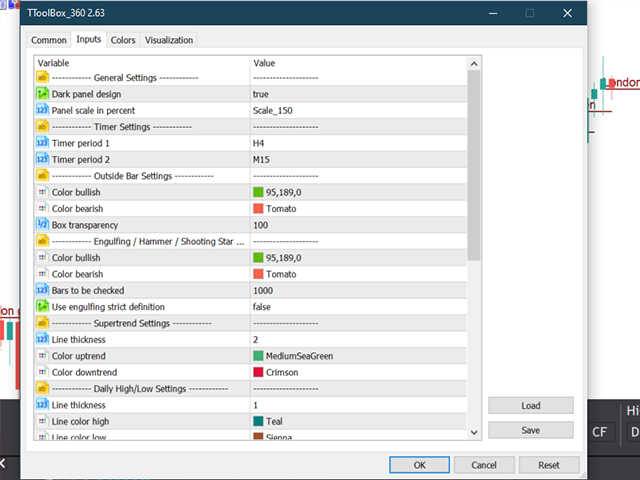
Indicator panel and dialogs
ToolBox 360 is easy to use because is has user friendly panels and dialogs. Just click on the buttons to enable or disable the features and options you want.