Investment Castle Support and Resistance MT4
- Indicators
-
Ahmed Alaaeldin Abdulrahman Ahmed Elherzawi
 Every day is a new opportunity. You can build on yesterday's success or put its failures behind and start over again. That's the way life is, with a new game every day, and that's the way baseball is.
 - Version: 1.4
- Updated: 7 August 2021
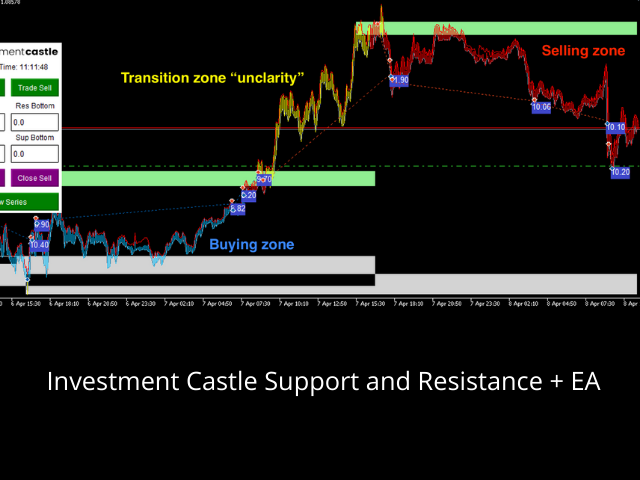
Investment Castle Support & Resistance — Automatic Buy/Sell Levels
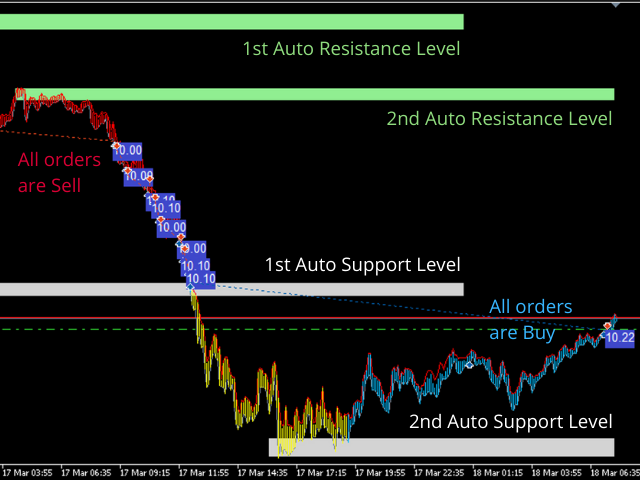
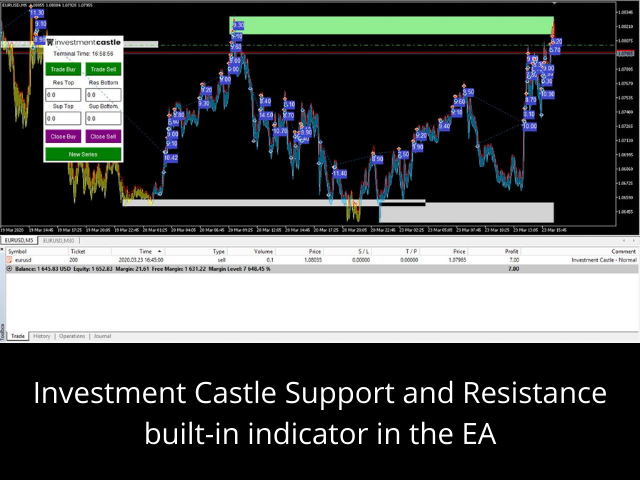
Stop drawing support and resistance by hand. This indicator maps the key Buy and Sell levels for you automatically and colours the candles by bias, so the side the market favours is obvious at a glance. It is the same Support & Resistance engine built into the Investment Castle EA.
What it does for you
- Automatic Buy/Sell levels: support and resistance are detected and plotted for you — no manual drawing.
- Colour-coded bias: candles turn blue for Buy and red for Sell by default, fully adjustable in the inputs.
- Faster decisions: instantly see where price is likely to react and which direction is favoured.
- Part of a system: the Support & Resistance core of the Investment Castle EA, working with Psychological Key Levels.
- Works everywhere: any symbol, any timeframe.
Who it is for: traders who want clean, objective S/R levels without the manual chart work.
Risk warning: trading involves substantial risk of loss. Always test on a demo account first and use risk settings you are comfortable with. Past performance does not guarantee future results.


Perfect work again !!! Big thanks