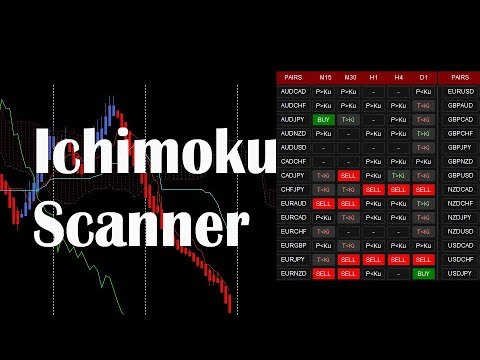
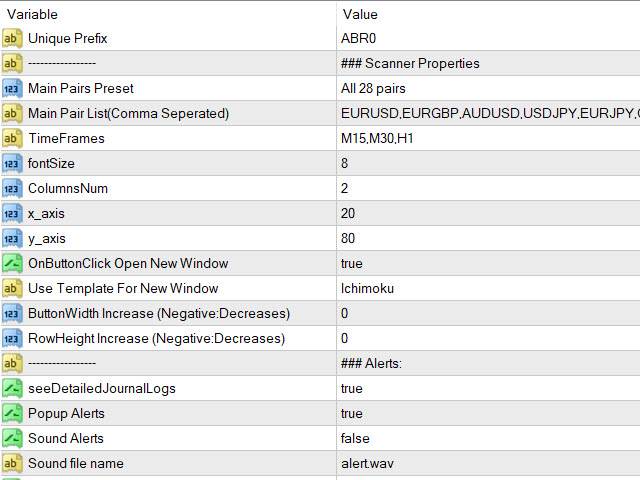
Ichimoku Scanner Dashboard
- Indicadores
-
Abir Pathak
 I create MT4 and MT5 indicators. They are mainly arrows and scanner indicators and also some essential utilities.
I'm hoping they will make your trading easier and make you profitable.
You can join my Telegram channel to keep track of all products I post. - Versión: 2.19
- Actualizado: 16 febrero 2021
- Activaciones: 20
El panel de control utiliza la estrategia Ichimoku para encontrar las mejores operaciones.
Obtenga indicadores/plantillas adicionales:
Y leer más acerca de la descripción detallada del producto y el uso aquí:
https://www.mql5.com/en/blogs/post/747457
Lea más acerca de Scanner características comunes en detalle aquí:
https://www.mql5.com/en/blogs/post/747456
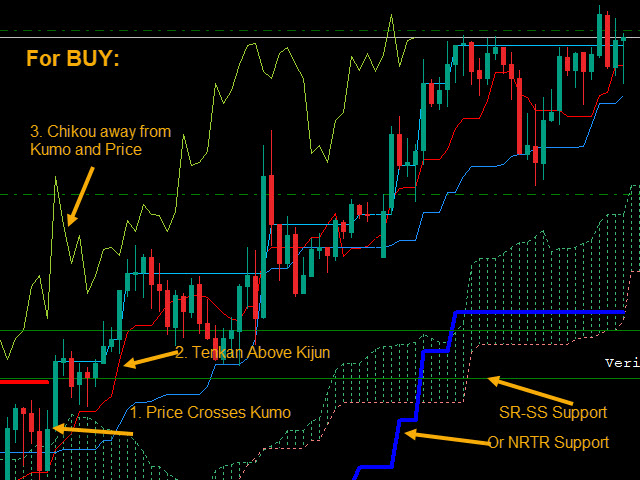
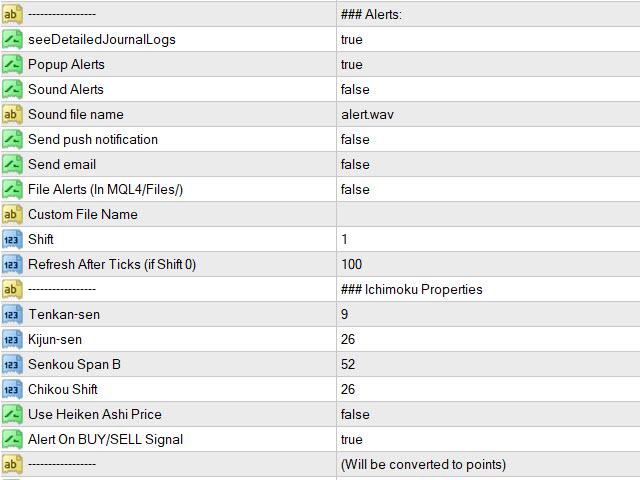
Características:
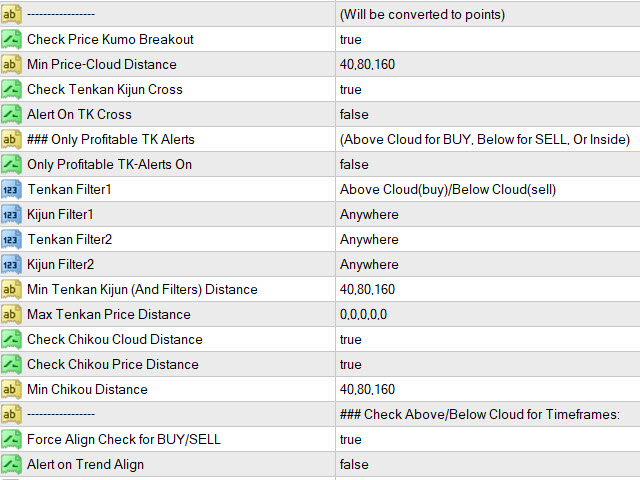
- Precio Kumo Breakout
- Cruce Tenkan-Kijun
- Chikou/Cloud y Chikou/Precio
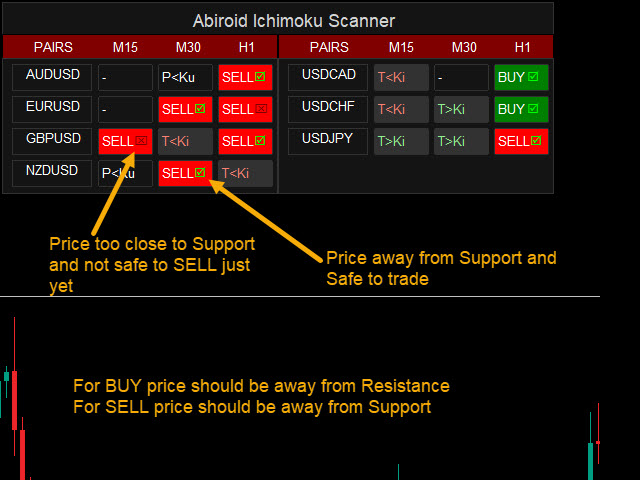
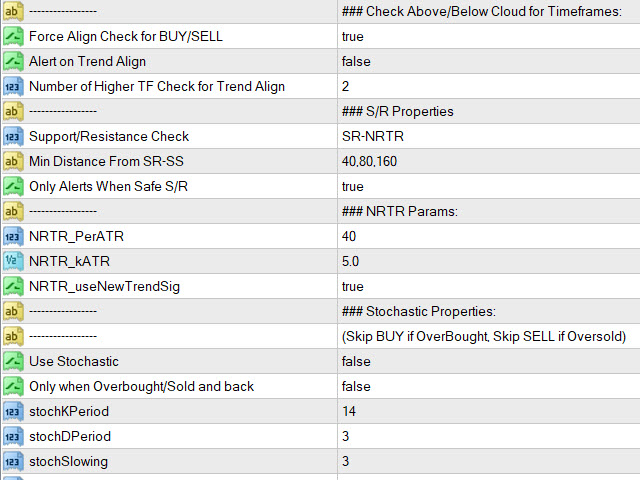
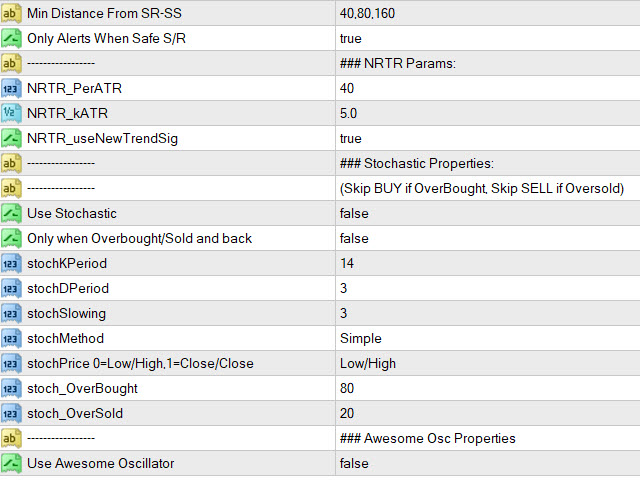
- Soporte/Resistencia (SR-SS o SR-NRTR)
- Estocástico OB/OS y vuelta
- Oscilador Asombroso
- Alineación de la tendencia Ichimoku en plazos superiores


Very powerful tool!!!!!! The dashboard gives you a complete outlook at a glance, I have been trading with Ichimoku for quite a while and this is exactly what I am looking for.. And the support from the Author(Abir Pathak) is incredible.