• Overview
  • Reviews
  • Comments (2)
  • What's new

TIL Daily OHLC Indicator

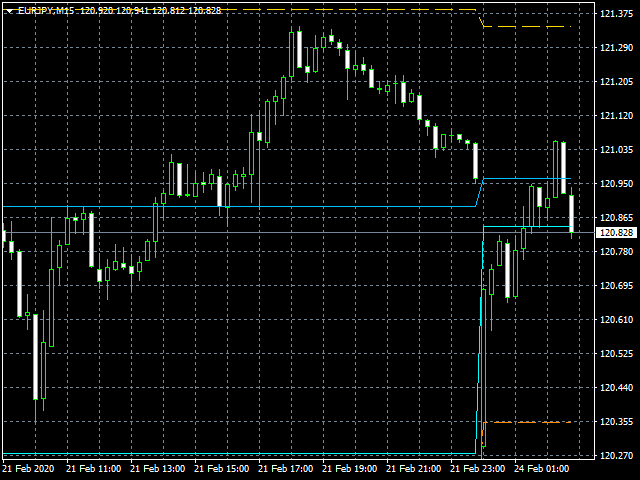
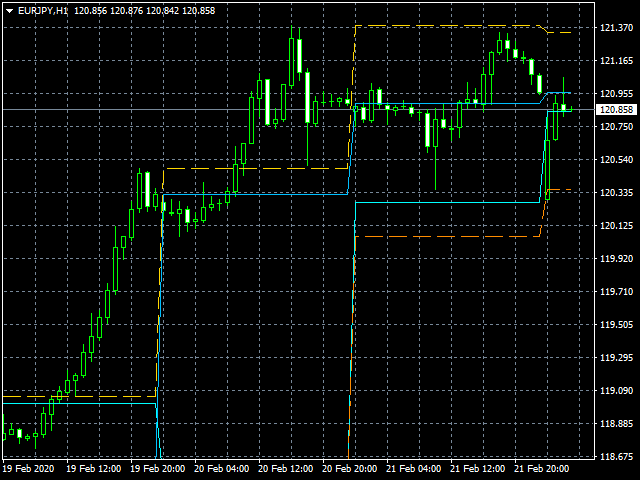
As the name implies, TIL Daily OHLC is a simple, straightforward yet effective tool to keep track of yesterday’s last Open, High, Low and Close prices. Any experienced trader knows the importance of these price levels – they are often used to navigate and predict the current day’s trend and price action as strong support and resistance.

When applied to a chart, the indicator shows 4 plots that projects the 4 price levels from the previous day to the next one. Each price level is color coded and their styles also differ as pairs. As any functional MT4 indicator, these properties can be configured in the Indicator’s settings. The indicator follows the settings below by default:

  • DailyOpen (last open price)
    • Color – Aqua
    • Line style – Solid
  • DailyHigh (last high price)
    • Color – Gold
    • Line style – Dash
  • DailyLow (last low price)
    • Color – DarkOrange
    • Line style – Dash
  • DailyClose (last close price)
    • Color – DeepSkyBlue
    • Line style – Solid

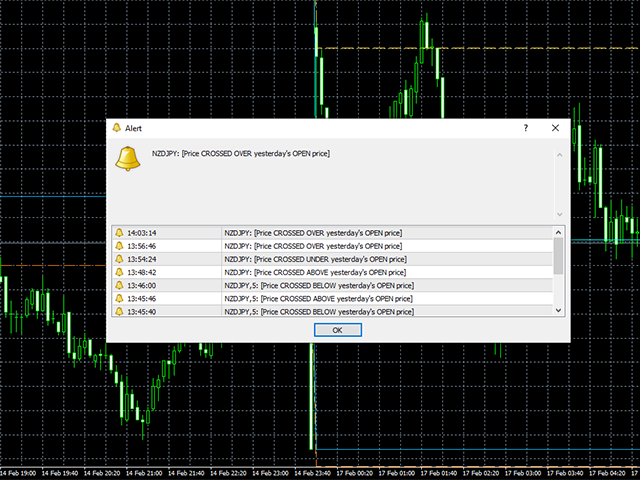
Most importantly, the indicator features an alert system that prompts you in the MT4 platform with a sound whenever the current price crosses one of these 4 price levels. If your MT4 trading account is linked to the MT4 mobile app, you can send these alerts to your mobile device through push notifications. The platform alerts and push notifications are activated in the indicator’s user Inputs by default.

Recommended products
HMA Trend
Pavel Zamoshnikov
4.59 (68)
A trend indicator based on the Hull Moving Average (HMA) with two periods. The Hull Moving Average is an improved variant of the moving average, which shows the moment of trend reversal quite accurately. It is often used as a signal filter. Combination of two types of Hull Moving Averages makes a better use of these advantages: HMA with a slow period identifies the trend, while HMA with a fast period determines the short-term movements and signals in the trend direction. Features The movement d
FREE
Indicator Description "Double Moving Averages with Fibonacci Fan" is a powerful MetaTrader 4 (MT4) tool designed to enhance trend analysis by combining: Two customizable Moving Averages (MA1 & MA2) for dynamic crossover signals. Fibonacci Retracement Levels to identify key support/resistance zones. Fibonacci Fan for projecting trend direction and potential reversal angles. Key Features: Dual MA System – Track short-term vs. long-term trends (e.g., EMA 9 + SMA 21). Smart Alerts – Popup, email
FREE
TrendPlus
Sivakumar Subbaiya
4.07 (14)
Trend Plus   Trendplus  Indicator   Time Frame: Suitable for any time frame.  Purpose: Trend Prediction. Blue and red candle indicate the buy and sell call respectively. Buy: When the blue candle is formed buy call is initiated. close the buy trades when the next red candle will formed.   Sell: When the Red candle is formed Sell call is initiated. close the Sell trades when the next blue candle will formed.   Happy trade!!
FREE
HeikenAshi
Vasile Verdes
Heiken Ashi Pro – Customizable Trend Visualization Tool Heiken Ashi Pro is an indicator for MetaTrader 4 that generates modified Heiken Ashi candles using a wide range of customizable parameters. It offers alternative smoothing options based on various moving average types and price calculation formulas, making it suitable for traders who prefer to adjust visual trend representation to fit their trading strategy. Main Features: Includes 34 types of moving averages such as SMA, EMA, HMA, KAMA, JM
FREE
Free automatic Fibonacci is an indicator that automatically plots a Fibonacci retracement based on the number of bars you select on the BarsToScan setting in the indicator. The Fibonacci is automatically updated in real time as new highest and lowest values appears amongst the selected bars. You can select which level values to be displayed in the indicator settings. You can also select the color of the levels thus enabling the trader to be able to attach the indicator several times with differe
FREE
Trendline indicator
David Muriithi
2 (1)
Are you tired of drawing trendlines every time you're analyzing charts? Or perhaps you would like more consistency in your technical analysis. Then this is for you. This indicator will draw trend lines automatically when dropped on a chart. How it works Works similar to standard deviation channel found on mt4 and mt5. It has 2 parameters: 1. Starting Bar 2. Number of bars for calculation The   starting bar   is the bar which drawing of the trend lines will begin, while the   number of bars for c
FREE
PZ Penta O MT4
PZ TRADING SLU
2.33 (3)
The Penta-O is a 6-point retracement harmonacci pattern which usually precedes big market movements. Penta-O patterns can expand and repaint quite a bit. To make things easier this indicator implements a twist: it waits for a donchian breakout in the right direction before signaling the trade. The end result is an otherwise repainting indicator with a very reliable trading signal. The donchian breakout period is entered as an input. [ Installation Guide | Update Guide | Troubleshooting | FAQ | A
FREE
Stat Monitor is a good information indicator. Benefits of the indicator: The indicator provides useful information - the current spread, the cost of one lot of the symbol, trading leverage and the recommended lot size for trading. You can use the indicator on the MetaTrader 4 trading platform of any broker. The indicator provides useful information. Version of the Stat Monitor indicator for MetaTrader 5 I wish you all good luck in trading and stable profit!
FREE
Indicator measures strength of each currency in your list. Main idea: It simply iterates through all combinations of pairs and adds difference between open and close in percent. Parameters: List of currencies - what currencies will be calculated (maximum is 8) Calculation type - from which data will be strength calculated Calculation data input - used as input related to calculation type Symbol suffix - used in case of suffix on symbols, e.g: when your symbols look like EURUSDm, EURUSDmicro etc
FREE
This indicator alerts you when/before new 1 or 5 minute bar candle formed. In other words,this indicator alerts you every 1/5 minutes. This indicator is especially useful for traders who trade when new bars formed. *This indicator don't work propery in strategy tester.Use this in live trading to check functionality. There is more powerful Pro version .In Pro version,you can choose more timeframe and so on. Input Parameters Alert_Or_Sound =Sound ----- Choose alert or sound or both to notify y
FREE
Rainbow MT4
Jamal El Alama
Rainbow MT4 is a technical indicator based on Moving average with period 34 and very easy to use. When price crosses above MA and MA changes color to green, it’s a signal to buy. When price crosses below MA and MA changes color to red, it’s a signal to sell. The Expert advisor ( Rainbow EA MT4) based on Rainbow MT4 indicator, as you can see in the short video below is now available here .
FREE
Dsc Super Sinais Mt4
Diogo Sawitzki Cansi
Recommended broker to use the indicator:   https://tinyurl.com/5ftaha7c   Indicator developed by Diogo Sawitzki Cansi to show possible trade points. Do not repaint. The results displayed in the past are exactly what happened. We also use it to hold trades longer and not get out on false reversal signals which are actually just a profit taking of trades and no one is trying to reverse the direction of the trend. Indicator Parameters: PERIOD: Period for analyzing the buying or selling force to fin
FREE
Traditional MACD MT4
Daniel Lewis
4.58 (55)
MACD indicator in MetaTrader 4/5 looks different than MACD does in most other charting software. That is because the MetaTrader 4/5 version of MACD displays the MACD line as a histogram when it is traditionally displayed as a line. Additionally, the MetaTrader 4/5 version computes the Signal line using an SMA, while according to MACD definition it is supposed to be an EMA. The MetaTrader 4/5 version also does not compute a true MACD Histogram (the difference between the MACD/Signal lines). This
FREE
MegaTrends
Sivakumar Subbaiya
1 (1)
Megatrends  Indicator   Time Frame: Suitable for any time frame.  Purpose: Trend Prediction. Blue and red color indicate the buy and sell call respectively. Buy: When the blue line is originating it is opened buy call. Sell: When the Red line is origination it is opened sell call Happy trade!! this indicator is suitable for all time frame, but our recommended time frame to use 1hour and 4 hours, suitable for any chart.
FREE
SMA Indicator
Nitu Brijesh Yadav
Arrow Indicator (Buy/Sell Alerts) – Simple Yet Powerful Tool!             Product Version: 1.01           Indicator Type: Trend Reversal Signals           Timeframes Supported: All (Recommended: H1, H4, D1)           Key Features: Buy Signal: Green upward arrow () appears below the candle  Sell Signal : Red downward arrow () appears above the candle Accurate Trend Reversal Detection – Based on tried and tested SMA strategy. ️ Clean Chart View – Minimalist, non-i
FREE
GS spread
Aleksander Gladkov
The indicator calculates the current spread for each tick using the formula Spread=(ASK-BID)/Point. Schedule of changes in the boundaries spread over the timeframe displayed in a separate window from the date of accession of the indicator. Two lines corresponding to the minimum and maximum spread values are displayed. The indicator window is self-adjusted according to the minimum and maximum values from the moment of launch. The minimum and maximum values for the entire period of the indicator o
FREE
Perfect Trendline Indicator for MT4 The Perfect Trendline Indicator uses two moving averages (MA) with periods of 3 and 7 to display the trend's direction. When the red line (fast moving average) is positioned above the green line (slow moving average) , the trend is considered bullish , with candles marked with green histograms . Conversely, a bearish trend is indicated when the red line is below the green line, and red histograms appear . «Indicator Installation & User Guide» MT4 Indicator I
FREE
Magic Macd Cross
Christophe Godart
This classic "old school" MAGIC MACD indicator gives you the cross of the parameters you set. Standart setting is (12,26,9) . The arrows give you a possible change of trend. Be careful and do not use this indicator as a single signal source. FREE version  Please feel free to check out our other REX indicator series. We do have other free indicators.     "OLD BUT GOLD"
FREE
Forex Market Profile and Vwap
Lorentzos Roussos
4.75 (4)
Volume Profile Indicator / Market Profile Indicator What this is not : FMP is not the classic letter-coded TPO display , does not display the overall chart data profile calculation , and , it does not segment the chart into periods and calculate them. What it does :  Most importantly ,the FMP indicator will process data that resides between the left edge of the user defined spectrum and the right edge of the user defined spectrum. User can define the spectrum by just pulling each end of the indi
FREE
Follow The Line
Oliver Gideon Amofa Appiah
3.94 (16)
FOLLOW THE LINE GET THE FULL VERSION HERE: https://www.mql5.com/en/market/product/36024 This indicator obeys the popular maxim that: "THE TREND IS YOUR FRIEND" It paints a GREEN line for BUY and also paints a RED line for SELL.  It gives alarms and alerts of all kinds. IT DOES NOT REPAINT and can be used for all currency pairs and timeframes. Yes, as easy and simple as that. Even a newbie can use it to make great and reliable trades. NB: For best results, get my other premium indicators for more
FREE
High Low Open Close MT4
Alexandre Borela
4.81 (21)
If you like this project, leave a 5 star review. This indicator draws the open, high, low and closing prices for the specified period and it can be adjusted for a specific timezone. These are important levels looked by many institutional and professional traders and can be useful for you to know the places where they might be more active. The available periods are: Previous Day. Previous Week. Previous Month. Previous Quarter. Previous year. Or: Current Day. Current Week. Current Month. Current
FREE
This is a regression tree indicator for MT4/MT5. This indicator classificate nodes on the time period so that the deviation becomes smaller, and displays regression line and channel for each node. It's free! Attached CartDemo.ex4 and CartDemo.ex5 is a Demo version and has the following limitations: Can't use HighSpeed method (default method is RandomForest) Maximum number of bars is 260 (increase from 200) There is no expiration date and can be started many times, but it stops after an hour.
FREE
Wise Men Indicator demo
Bohdan Kasyanenko
3 (2)
The indicator displays signals according to the strategy of Bill Williams on the chart. Demo version of the indicator has the same features as the paid, except that it can work only on a demo account . Signal "First Wise Man" is formed when there is a divergent bar with angulation.  Bullish divergent bar - with lower minimum and closing price in the upper half. Bearish divergent bar - higher maximum and the closing price at the bottom half. Angulation is formed when all three lines of Alligator
FREE
OrderBlock TS Roman
Vladislav Vlastovskii
3.8 (5)
Индикатор строит блоки заказов (БЗ) по торговой системе (ТС) Романа. Поиск блоков осуществляется одновременно на двух таймфремах: текущем и старшем (определяемым в настройках). Для оптимизации и игнорирования устаревших блоков в настройках задается ограничение количества дней в пределах которых осуществляется поиск блоков. Блоки строятся по правилам ТС состоящем из трех шагов: какую свечу вынесли (что?); какой свечой вынесли (чем?); правило отрисовки (как?).
FREE
Coloured Bollinger Bands
Moegamat Luqmaan Titus
Coloured Bollinger Bands The Coloured Bollinger Bands indicator is an enhanced version of the standard Bollinger Bands, offering customizable features to suit your trading needs. It uses the classic Simple Moving Average (SMA) as the middle band, and allows you to easily change the appearance of the bands, including the option to select colors and line types, ensuring better visual clarity and adaptability on your charts
FREE
Highlights trading sessions on the chart The demo version only works on the AUDNZD chart!!! The full version of the product is available at: (*** to be added ***) Trading Session Indicator displays the starts and ends of four trading sessions: Pacific, Asian, European and American. the ability to customize the start/end of sessions; the ability to display only selected sessions; works on M1-H2 timeframes; The following parameters can be configured in the indicator: TIME_CORRECTION = Correct
FREE
PZ Pivot Points
PZ TRADING SLU
4.6 (10)
This indicator displays pivot points in the chart, including historical vales, and supports many calculation modes for Pivot Points and S/R levels. [ Installation Guide | Update Guide | Troubleshooting | FAQ | All Products ] It plots historical levels for backtesting purposes It allows you to select the reference timeframe It implements different Pivot Point calculation modes It implements different SR calculation modes It implements customizable colors and sizes Calculation Modes The indicator
FREE
TTF Line AM
Andriy Matviyevs'kyy
The presented indicator draws a trend line and points of change in its direction on the price chart based on the TTF (Trend Trigger Factors) and ATR indicators. The indicator advantageously combines ease of use, speed of reaction to a change in trend direction and reliability of signals. The indicator is intuitive to use: Change in line direction - change in trend direction; Change in line color warns of an imminent change in direction. The indicator does not repaint and allows you to send notif
FREE
Power Trend Free
Yurij Kozhevnikov
5 (2)
Power Trend Free - the indicator shows the trend strength in the selected period. Input Parameters The indicator has three input parameters: Period - a positive number greater than one, it shows the number of candlesticks used for calculations. If you enter one or zero, there will be no error, but the indicator will not be drawn. Applied Price - the standard "Apply to:" set meaning data used for the indicator calculation: Close - Close prices; Open - Open prices; High - High prices; Low - Low p
FREE
Tipu Heikin Ashi Panel
Kaleem Haider
4.56 (18)
Tipu Heikin-Ashi Panel is the modified version of the original Heiken Ashi indicator published by MetaQuotes here . A professional version of this indicator is available here . Features An easy to use Panel that shows the Heiken Ashi trend of selected timeframe. Customizable Buy/Sell alerts, push alerts, email alerts, or visual on-screen alerts. Customizable Panel. The panel can be moved to any place on the chart or minimized to allow more space. Heikin means "the average", and Ashi means "foot
FREE
Buyers of this product also purchase
Gann Made Easy
Oleg Rodin
4.81 (132)
Gann Made Easy is a professional and easy to use Forex trading system which is based on the best principles of trading using the theory of W.D. Gann. The indicator provides accurate BUY and SELL signals including Stop Loss and Take Profit levels. You can trade even on the go using PUSH notifications. PLEASE CONTACT ME AFTER PURCHASE TO GET MY TRADING TIPS PLUS A GREAT BONUS! Probably you already heard about the Gann trading methods before. Usually the Gann theory is a very complex thing not only
M1 Sniper
Oleg Rodin
5 (4)
M1 SNIPER is an easy to use trading indicator system. It is an arrow indicator which is designed for M1 time frame. The indicator can be used as a standalone system for scalping on M1 time frame and it can be used as a part of your existing trading system. Though this trading system was designed specifically for trading on M1, it still can be used with other time frames too. Originally I designed this method for trading XAUUSD and BTCUSD. But I find this method helpful in trading other markets a
Cycle Maestro
Stefano Frisetti
If a new green  NOTE: CYCLEMAESTRO is distributed only on this website, there are no other distributors. Demo version is for reference only and is not supported. Full versione is perfectly functional and it is supported CYCLEMAESTRO , the first and only indicator of Cyclic Analysis, useful for giving signals of TRADING, BUY, SELL, STOP LOSS, ADDING. Created on the logic of  Serghei Istrati  and programmed by  Stefano Frisetti ;  CYCLEMAESTRO  is not an indicator like the others, the challenge wa
Scalper Inside PRO
Alexey Minkov
4.74 (66)
An exclusive indicator that utilizes an innovative algorithm to swiftly and accurately determine the market trend. The indicator automatically calculates opening, closing, and profit levels, providing detailed trading statistics. With these features, you can choose the most appropriate trading instrument for the current market conditions. Additionally, you can easily integrate your own arrow indicators into Scalper Inside Pro to quickly evaluate their statistics and profitability. Scalper Inside
Algo Pumping MT4
Ihor Otkydach
4.92 (12)
PUMPING STATION – Your Personal All-inclusive strategy Introducing PUMPING STATION — a revolutionary Forex indicator that will transform your trading into an exciting and effective activity! This indicator is not just an assistant but a full-fledged trading system with powerful algorithms that will help you start trading more stable! When you purchase this product, you also get FOR FREE: Exclusive Set Files: For automatic setup and maximum performance. Step-by-step video manual: Learn how to tra
Dynamic Forex28 Navigator
Bernhard Schweigert
5 (5)
Specials Discount now. The Next Generation Forex Trading Tool. Dynamic Forex28 Navigator is the evolution of our long-time, popular indicators, combining the power of three into one: Advanced Currency Strength28 Indicator (695 reviews) + Advanced Currency IMPULSE with ALERT (520 reviews) + CS28 Combo Signals (recent Bonus) Details about the indicator  https://www.mql5.com/en/blogs/post/758844 What Does The Next-Generation Strength Indicator Offer? Everything you loved about the originals, now
Currency Strength Exotics
Bernhard Schweigert
4.88 (32)
CURRENTLY 20% OFF ! Best Solution for any Newbie or Expert Trader! This Indicator is specialized to show currency strength for any symbols like Exotic Pairs Commodities, Indexes or Futures. Is first of its kind, any symbol can be added to the 9th line to show true currency strength of Gold, Silver, Oil, DAX, US30, MXN, TRY, CNH etc. This is a unique, high quality and affordable trading tool because we have incorporated a number of proprietary features and a new formula. Imagine how your trading
Trend Screener
STE S.S.COMPANY
4.78 (93)
Unlock the Power of Trends Trading with the Trend Screener Indicator: Your Ultimate Trend Trading Solution powered by Fuzzy Logic and Multi-Currencies System! Elevate your trading game with the Trend Screener, the revolutionary trend indicator designed to transform your Metatrader into a powerful Trend Analyzer. This comprehensive tool leverages fuzzy logic and integrates over 13 premium features and three trading strategies, offering unmatched precision and versatility. LIMITED TIME OFFER : Tre
Gold Stuff
Vasiliy Strukov
4.85 (262)
Gold Stuff is a trend indicator designed specifically for gold and can also be used on any financial instrument. The indicator does not redraw and does not lag. Recommended time frame H1. At it indicator work full auto  Expert Advisor EA Gold Stuff. You can find it at my profile. Contact me immediately after the purchase to get   personal bonus!  You can get a free copy of our Strong Support and Trend Scanner indicator, please pm. me! Settings  and manual here  Please note that I do not sell my
IQ Gold Gann Levels a non-repainting, precision tool designed exclusively for XAUUSD/Gold intraday trading. It uses W.D. Gann’s square root method to plot real-time support and resistance levels, helping traders spot high-probability entries with confidence and clarity. William Delbert Gann (W.D. Gann) was an exceptional market analyst, whose trading technique was based on a complex blend of mathematics, geometry, astrology, and ancient mathematics which proved to be extremely accurate. Download
PZ Trend Trading
PZ TRADING SLU
4.8 (5)
Capture every opportunity: your go-to indicator for profitable trend trading Trend Trading is an indicator designed to profit as much as possible from trends taking place in the market, by timing pullbacks and breakouts. It finds trading opportunities by analyzing what the price is doing during established trends. [ Installation Guide | Update Guide | Troubleshooting | FAQ | All Products ] Trade financial markets with confidence and efficiency Profit from established trends without getting whip
Gold Buster M1 System is an easy to use tool for the XAUUSD pair. But, despite the fact that the system was originally developed exclusively for trading gold, the system can also be used with some other currency pairs like GBPUSD, USDJPY and some others. After the purchase, I will give you a list of trading pairs that can be used with the system in addition to XAUUSD, which will expand your possibilities for using this system. Moreover the system can be used with various time frames. ALL INDICAT
MBFX Timing
Mohamed Hassan
5 (3)
After purchase, contact me in private to get 7 days of FREE testing with EA Forex Proton where the robot automatically takes the trade alerts from MBFX Timing! MBFX Timing is an indicator that was developed and created by Mostafa Belkhayate, one of the best traders in the world. We decided to create a modified version that takes inspiration from the Stochastic Oscillator and the Relative Strength Quality Index indicators to improve your trading.  One of the main reasons we released MBFX Timing
This dashboard shows the latest available harmonic patterns for the selected symbols, so you will save time and be more efficient / MT5 version . Free Indicator:   Basic Harmonic Pattern Comparison of "Basic Harmonic Pattern" vs. "Basic Harmonic Patterns Dashboard" Indicators Feature Basic Harmonic Pattern Basic Harmonic Patterns Dashboard Functionality Detects and displays harmonic patterns on a single chart Searches multiple symbols and timeframes for harmonic patterns, displays results on
Support Resistance screnner
STE S.S.COMPANY
4.94 (36)
Support And Resistance Screener  Breakthrough unique Solution With All Important levels analyzer and Markets Structures Feature Built Inside One Tool! Our indicator has been developed by traders for traders and with one Indicator you will find all Imporant market levels with one click. LIMITED TIME OFFER : Support and Resistance Screener Indicator is available for only 50 $ and lifetime. ( Original price 125$ )  (offer extended) The available tools ( Features ) in our Indicator are :  1. HH-LL
CURRENTLY 31% OFF !! Best Solution for any Newbie or Expert Trader! This indicator is a unique, high quality and affordable trading tool because we have incorporated a number of proprietary features and a secret formula. With only ONE chart it gives Alerts for all 28 currency pairs. Imagine how your trading will improve because you are able to pinpoint the exact trigger point of a new trend or scalping opportunity! Built on new underlying algorithms it makes it even easier to identify and confir
IQ FX Gann Levels a precision trading indicator based on W.D. Gann’s square root methods. It plots real-time, non-repainting support and resistance levels to help traders confidently spot intraday and scalping opportunities with high accuracy. William Delbert Gann (W.D. Gann) was an exceptional market analyst, whose trading technique was based on a complex blend of mathematics, geometry, astrology, and ancient mathematics which proved to be extremely accurate. Download the Metatrader 5 Version M
Enigmera
Ivan Stefanov
5 (7)
ENIGMERA: The core of the market The indicator’s code has been completely rewritten. Version 3.0 adds new functionalities and removes bugs that had accumulated since the indicator’s inception. Introduction This indicator and trading system is a remarkable approach to the financial markets . ENIGMERA uses the fractal cycles to accurately calculate support and resistance levels. It shows the authentic accumulation phase and gives direction and targets.  A system that works whether we are in a tre
Special offer : ALL TOOLS , just $35 each! New tools   will be   $30   for the   first week   or the   first 3 purchases !  Trading Tools Channel on MQL5 : Join my MQL5 channel to update the latest news from me Introducing the revolutionary RSI Kernel Optimized with Scanner , a cutting-edge tool that redefines traditional RSI analysis by integrating the powerful Kernel Density Estimation (KDE) algorithm. This advanced indicator not only provides real-time insights into market trends but also in
ACB Breakout Arrows
KEENBASE SOFTWARE SOLUTIONS
4.15 (34)
The ACB Breakout Arrows indicator provides a crucial entry signal in the market by detecting a special breakout pattern. The indicator constantly scans the chart for a settling momentum in one direction and provide the accurate entry signal right before the major move.  Get multi-symbol and multi-timeframe scanner from here - Scanner for ACB Breakout Arrows MT4 Key features Stoploss and Take Profit levels are provided by the indicator. Comes with a MTF Scanner dashboard which tracks the breako
Hydra Trend Rider is a non-repainting, multi-timeframe trend indicator that delivers precise buy/sell signals and real-time alerts for high-probability trade setups. With its color-coded trend line, customizable dashboard, and mobile notifications, it's perfect for traders seeking clarity, confidence, and consistency in trend trading. Download the Metatrader 5 Version Message us here after purchase to get the Indicator Manual. Download Now! Offer valid only for next 10 Buyers. Price will increas
The TPX Dash Needle is everything you need to find the famous Didi Needles on several timeframes and in several pairs at the same time. These are the simultaneous meeting of the 3, 8 and 20 averages that, aligned with the ADX indicator, are synonymous with large and strong movements in the market. With no monthly fees, you get a tool for a fair price that, placed on a VPS, sends the message to your cell phone right away, giving you more free time and not having to be glued to the screen all day
Gold Venamax MT4
Sergei Linskii
2 (1)
Gold Venamax - this is a best stock technical indicator. The indicator algorithm analyzes the price movement of an asset and reflects volatility and potential entry zones. Live Signal of manual trading >>>   [ Click Here ] Indicator features: This is a super indicator with Magic and two Blocks of trend arrows for comfortable and profitable trading. Red Button for switching blocks is displayed on the chart. Magic is set in the indicator settings, so that you can install the indicator on two chart
CURRENTLY 26% OFF Best Solution for any Newbie or Expert Trader! This Indicator is a unique, high quality and affordable trading tool because we have incorporated a number of proprietary features and a new formula. With only ONE chart you can read Currency Strength for 28 Forex pairs! Imagine how your trading will improve because you are able to pinpoint the exact trigger point of a new trend or scalping opportunity? User manual: click here That's the first one, the original! Don't buy a worthle
Stratos Pali
Michela Russo
5 (3)
Stratos Pali Indicator   is a revolutionary tool designed to enhance your trading strategy by accurately identifying market trends. This sophisticated indicator uses a unique algorithm to generate a complete histogram, which records when the trend is Long or Short. When a trend reversal occurs, an arrow appears, indicating the new direction of the trend. Important Information Revealed Leave a review and contact me via mql5 message to receive My Top 5 set files for Stratos Pali at no cost! Dow
Quantum Profile System
Stanislav Konin
5 (2)
Quantum Profile System  —   is a comprehensive professional trading system with advanced algorithms. It combines trend direction analysis, volume concentration at key levels, dynamic adaptation to market volatility, and signal generation without delays or repainting. Quantum Profile System integrates the functionality of a volume profile based on linear regression with an adaptive trend channel using ATR. It features volume profiles with construction and display in two directions. Multi-level v
TPSproTREND PrO
Roman Podpora
4.65 (23)
Entry points at the bar close,  without redrawing .  Trend scanner  across all assets,  MTF - mode  and much more in one tool. We recommend using it together with   RFI LEVELS. ИНСТРУКЦИЯ RUS   /   INSTRUCTIONS  ENG         /        VERSION MT5 Main functions: Accurate entry signals WITHOUT REPAINTING! Once a signal appears, it remains valid! This is a significant distinction from repainting indicators that might provide a signal and then alter it, potentially leading to deposit losses. Now, you
FX Gunslinger
Oleg Rodin
5 (3)
Forex Gunslinger  is a BUY/SELL reversal signals indicator designed around the idea of combining support/resistance, crossovers and oscillators in MTF mode.  When everything is aligned the indicator generates a BUY or SELL signal.   Though the indicator is based around the MTF idea, the algorithm is very stable and generates reliable reversal signals. This is an MTF type indicator where it can use a higher or a lower time frame to calculate the signals for your current chart. Though the original
Volatility Trend System - a trading system that gives signals for entries. The volatility system gives linear and point signals in the direction of the trend, as well as signals to exit it, without redrawing and delays. The trend indicator monitors the direction of the medium-term trend, shows the direction and its change. The signal indicator is based on changes in volatility and shows market entries. The indicator is equipped with several types of alerts. Can be applied to various trading ins
Daily Candle Predictor is an indicator that predicts the closing price of a candle. The indicator is primarily intended for use on D1 charts. This indicator is suitable for both traditional forex trading and binary options trading. The indicator can be used as a standalone trading system, or it can act as an addition to your existing trading system. This indicator analyzes the current candle, calculating certain strength factors inside the body of the candle itself, as well as the parameters of
More from author
TIL New Bar Timer executes one simple yet very powerful task - it displays the time left before a new bar forms in any timeframe. With this indicator, you can effectively prepare to enter or exit trades in most occasions, as TIMING IS EVERYTHING. TIL New Bar Timer also changes color gradually as the timer ticks down to zero. This helps the user to estimate quickly how much time there is left in one glance. There are basically three colors that the timer changes to: Red - this means that a new ba
Pivot Point is a technical indicator widely used by traders to predict major price movements by calculating various levels of support and resistance. Investopedia defines the pivot point as follows: A technical analysis indicator used to determine the overall trend of the market over different time frames. The pivot point itself is simply the average of the high, low and closing prices from the previous trading day. On the subsequent day, trading above the pivot point is thought to indicate ongo
TIL Currency Performance Meter is an intuitive technical indicator for quantifying and visualizing the current momentum and relative strength of the eight major currencies, namely: USD, EUR, GBP, CHF, JPY, CAD, AUD, and NZD, on all timeframes. This is achieved by calculating and consolidating the price percent changes of 28 currency pairs from a certain point in time. The indicator generates a chart wherein each currency is represented by a color-coordinated bar that either shoots up or drops do
TIL Multi RSI indicator applies RSI to 28 currency pairs all at once and displays the most current signal of each one in a two-column list. The currency pairs involved are the combinations of the eight major currencies (USD, EUR, GBP, CHF, JPY, CAD, AUD, and NZD). All the currency pairs are sorted automatically from the one with the highest signal down to the one with the lowest signal in a two-column list starting from the top left to the bottom right. Just a quick recap on what the Relative St
The Doji candlestick pattern is characterized by one that has its open and close prices nearly (if not exactly) equal and resembles the shape of a cross. It is often regarded as a sign of indecision and is especially significant if seen in a down trend or up trend, which potentially signals that sellers or buyers are losing conviction. The TIL Doji Price Action finds and marks all Doji candlestick patterns and intelligent approximations thereof. In addition, it predicts the direction of price wi
The TIL Timeframe Overlay indicator is the perfect tool for multiple timeframe analysis . It does the simple yet powerful task of overlaying a candlestick chart of a different timeframe over another allowing you to see the BIGGER picture and see the underlying TREND amid the noise and volatile price action. Please see the screenshots below for examples. Features: It works in ALL timeframe. It works in ANY instrument/symbol. Displays ENTIRE candlesticks (body and wick) of other timeframes includi
Fibonacci retracement is one of the most reliable and used technical analysis tools for trading. It uses the so called “golden ratio” to predict certain levels of support (price movement reverses from downward to upward) and resistance (price movement reverses from upward to downward) which is a mathematical pattern seen through out nature and even the universe. Because so many traders make use of this trading strategy and watch these price levels, more often than not the Fibonacci levels become
Trading Indicator Lab’s Trend Navigator for MT4 is an indicator that can help you reveal the underlying trends in any chart on any timeframe. Determining Trends It only takes a minute or two to analyze the indicator with its simple yet insightful methods of representing bullish, bearish and ranging price action across the chart. It forms a single line that runs in 3 directions: Upward direction – represents a significant bullish price action Horizontal direction – represents ranging price action
Trading Indicator Lab’s Candle Volume Heatmap for MT4 merges volume with price by applying gradient-colored dots on the bars. It can also detect bars that have the most volume and the least volume. Gradient Coloring When applied to a chart, the Candle Volume Heatmap indicator applies colored dots to each bar which may vary according to its volume. The chart becomes a heatmap where you can easily spot which parts of the bar history are “hottest” or the bars that had the greatest number of volume
Trading Indicator Lab's Volume by Price is a volume-based indicator for MT4 that reveals price levels with the most and least volume for each bar within a given period. How It Works You can think of the indicator as a running volume profile that displays the most voluminous price level and the price level that has the least volume. For each bar, the indicator calculates the volume vertically in the price axis. As this is calculated, the indicator creates 2 signals: (1) a large red dot which repr
Filter:
No reviews
Reply to review
Version 1.1 2020.02.24
- Commented out a line that prints a variable used for debugging.
- Updated details in the About tab