Osama Echchakery / Продавец
Опубликованные продукты

The Piercing candlestick pattern is formed by two candles. Here’s how to identify the Piercing candlestick pattern: The first candle must be bearish The second candle must be bullish The open level of the second candle must be below the first candle (there’s a gap there) The close of the second candle must be above the 50% level of the body of the first candle This 2-candle bullish candlestick pattern is a reversal pattern, meaning that it’s used to find bottoms. For this reason, we want to

Свечная модель бычьего поглощения формируется двумя свечами. Вот как идентифицировать свечной паттерн «Бычье поглощение»: Первая свеча должна быть медвежьей. Вторая свеча должна быть бычьей. Тело второй свечи должно покрывать тело первой свечи. Эта бычья свечная модель из двух свечей является разворотной моделью, то есть она используется для поиска оснований. По этой причине мы хотим увидеть эту модель после движения вниз, показывая, что быки начинают брать контроль. Когда свечной паттерн

Свечной паттерн «Молот» формируется одной единственной свечой. Вот как определить свечной паттерн «Молот»: У свечи маленькое тело. Фитиль внизу должен быть большим по сравнению с телом. Вверху он не должен иметь фитиля или быть очень маленьким. Цвет тела не имеет значения Этот бычий свечной паттерн из 1 свечи является разворотным паттерном, то есть он используется для поиска оснований. По этой причине мы хотим увидеть эту модель после движения вниз, показывая, что быки начинают брать контроль.

The Dragonfly Doji candlestick pattern is formed by one single candle. Here’s how to identify the Dragonfly Doji candlestick pattern: The candle has no body The wick at the bottom must be big At the top, it should have no wick, or be very small This 1-candle bullish candlestick pattern is a reversal pattern, meaning that it’s used to find bottoms. For this reason, we want to see this pattern after a move to the downside, showing that bulls are starting to take control. When a Dragonfly Doji can

The White Marubozu candlestick pattern is formed by one single candle. Here’s how to identify the White Marubozu candlestick pattern: One single bullish candle The body must be big The wicks should be small or non-existent This 1-candle bullish candlestick pattern is a reversal pattern, meaning that it’s used to find bottoms. For this reason, we want to see this pattern after a move to the downside, showing that bulls are starting to take control. When a White Marubozu candlestick pattern a
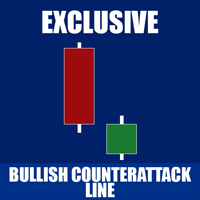
The Bullish Counterattack Line candlestick pattern is formed by two candles. Here’s how to identify the Bullish Counterattack candlestick pattern: The first candle is bearish and big The second candle is bullish and small There’s a gap between the close of the first candle and the open of the second candle They both close at the same level This 2-candle bullish candlestick pattern is a reversal pattern, meaning that it’s used to find bottoms. For this reason, we want to see this pattern after a

The Three Outside Up candlestick pattern is formed by three candles. Here’s how to identify the Three Outside Up candlestick pattern: The first candle is bearish and small The second candle is bullish and engulfs the first one completely The third candle is bullish and closes above the other ones This 3-candle bullish candlestick pattern is a reversal pattern, meaning that it’s used to find bottoms. For this reason, we want to see this pattern after a move to the downside, showing that bulls ar

The Tweezer Bottom candlestick pattern is formed by two candles. Here’s how to identify the Tweezer Bottom candlestick pattern: The first candle is bearish The second candle is bullish The lows from both candles should be pretty much at the same level This 2-candle bullish candlestick pattern is a reversal pattern, meaning that it’s used to find bottoms. For this reason, we want to see this pattern after a move to the downside, showing that bulls are starting to take control. When a Tweezer Bot

The Bullish Harami candlestick pattern is formed by two candles. Here’s how to identify the Bullish Harami candlestick pattern: The first candle must be bearish and have a big body The second candle must be small and bullish The second candle is inside the body of the first candle This 2-candle bullish candlestick pattern is a reversal pattern, meaning that it’s used to find bottoms. For this reason, we want to see this pattern after a move to the downside, showing that bulls are starting t

The Three Inside Up candlestick pattern is formed by three candles. Here’s how to identify the Three Inside Up candlestick pattern: The first candle must be bearish The second candle must be bullish The close of the second candle should ideally be above the 50% level of the body of the first one The third candle should close above the first one This 3-candle bullish candlestick pattern is a reversal pattern, meaning that it’s used to find bottoms. For this reason, we want to see this patter

The Three White Soldiers candlestick pattern is formed by three candles. Here’s how to identify the Three White Soldiers candlestick pattern: Three consecutive bullish candles The bodies should be big The wicks should be small or non-existent This 3-candle bullish candlestick pattern is a reversal pattern, meaning that it’s used to find bottoms. For this reason, we want to see this pattern after a move to the downside, showing that bulls are starting to take control. When a Three White Sold

The Morning Star candlestick pattern is formed by three candles. Here’s how to identify the Morning Star candlestick pattern: The first candle must be bearish The third candle must be bullish The second candle must be small compared to the others, like a Doji or a Spinning Top The color of the second candle doesn’t matter Ideally, the body of the second candle shouldn’t overlap with the bodies of the other two candles This 3-candle bullish candlestick pattern is a reversal pattern, meaning

Свечной паттерн «Молот» формируется одной единственной свечой. Вот как определить свечной паттерн «Молот»: У свечи маленькое тело. Фитиль внизу должен быть большим по сравнению с телом. Вверху он не должен иметь фитиля или быть очень маленьким. Цвет тела не имеет значения Этот бычий свечной паттерн из 1 свечи является разворотным паттерном, то есть он используется для поиска оснований. По этой причине мы хотим увидеть эту модель после движения вниз, показывая, что быки начинают брать контроль.

Представляем советник Last Hope , один из 30 моих лучших персональных советников, новаторский советник MQL4, который меняет ваш подход к торговле! Разработано мной и с любовью, опыт торговли более 5 лет. ВАЖНЫЙ! Рекомендуемые пары: EURCHF, EURUSD, USDCHF, GBPCAD и EURCAD. Акционная цена всего 127 долларов США ! Цена СКОРО увеличится до 177 долларов США, а затем увеличится на 50 долларов США после каждых 10 покупок! Этот советник не нуждается в описании, протестируйте советник самостоя

Infi Trade: Революционизируйте Вашу Торговлю с Помощью Продвинутой Автоматизации Раскройте Мощь Автоматизированной Торговли: Infi Trade — это передовой Экспертный Советник, предназначенный для трейдеров, которые стремятся к эффективности и прибыльности на рынке Форекс. Наш EA использует сложную стратегию хеджирования сетки для максимизации ваших торговых возможностей, обеспечивая бесперебойный автоматизированный торговый процесс. Интеллектуальная Стратегия Хеджирования Сетки: В основе Infi Trad

The Bearish Engulfing candlestick, a potent signal in technical analysis, marks a potential shift in market sentiment. This compelling pattern unfolds when a smaller bullish candle is completely overshadowed by a larger bearish candle. The Bearish Engulfing signifies a transition from bullish to bearish momentum, capturing the attention of traders anticipating a downtrend. Savvy investors leverage this pattern to identify potential selling opportunities, signaling a shift towards bearish market

The Hanging Man candlestick, a significant player in technical analysis, provides a crucial signal for potential trend reversals in financial markets. Characterized by its small real body, long lower shadow, and minimal upper shadow, the Hanging Man hints at a shift from bullish to bearish momentum. Savvy traders use this pattern to identify potential selling opportunities, suggesting a possible weakening of an uptrend. Dive into the intricacies of the Hanging Man candlestick to refine your mark

The Shooting Star candlestick, a key player in technical analysis, serves as a harbinger of potential trend reversals in financial markets. Distinguished by its small real body, long upper shadow, and minimal lower shadow, the Shooting Star suggests a shift from bullish to bearish momentum. Traders keen on market insights often use this pattern to identify potential selling opportunities, highlighting potential weakness after an uptrend. Harness the power of the Shooting Star to refine your cand
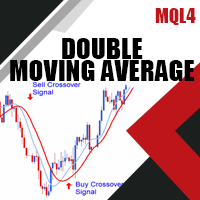
"GA Moving Average" («GA Скользящая средняя») - это советник (Expert Advisor, EA), разработанный для автоматизации торговли на основе стратегии пересечения скользящих средних. С помощью настраиваемых параметров этот EA позволяет трейдерам создать идеальную стратегию, соответствующую их предпочтениям и видению рынка.
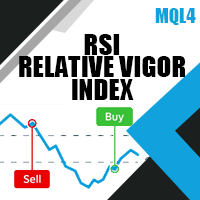
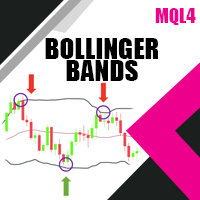
Основная концепция "GA Moving Average" EA заключается в использовании скользящих средних для определения потенциальных торговых возможностей. Анализируя взаимодействие различных с
