MetaTrader 4용 기술 지표 - 45

The indicator can help traders to assess in advance the number of Lots, Balance and Equity, if the price deviates from the current levels. The indicator will be useful for those who trade using Martingale.
Features The indicator belongs to the category of risk management. The indicator helps to assess in advance the account change that would happen in case of possible price change from the current value to a threshold. It also recalculates swap, lock, pending orders, take profit and stop loss.
FREE

This is Demo version of PipsFactoryWeekly This indicator depends on High and Low price of Currency in last Week and then i made some secret equations to draw 10 lines.
Features: You will know what exactly price you should enter the market . You will know when to be out of market. You will know you what should you do in market: Buy Sell Take profit and there are 3 levels to take your profit Support Resistance Risk to buy Risk to Sell
Signal Types and Frame used: You can use this indicator jus
FREE
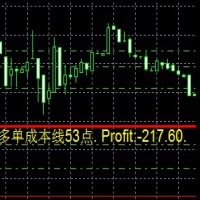
Dies ist ein Indikator
Dies ist ein Indikator, der immer die Auftragskosten und die Rentabilität in Echtzeit widerspiegelt
Besonders wenn es auf die Martin-Strategie angewendet wird, ist es bequemer 这是一个指标
这是一个时时反应订单成本 和实时 盈利值得 指标
尤其应用于 马丁策略的时候 更加方便 This is an indicator
This is an indicator that always reflects the order cost and real-time profitability
Especially when applied to the Martin strategy, it is more convenient
FREE

Magneto Power MA - трендовый осциллятор. Основан на классическом индикаторе moving average, но при этом имеет нестандартный способ интерпретации. Здесь нет никаких фокусов с пересечениями мувингов, только гибридная работа MA и волатильности инструмента. При этом при должной настройке может составить конкуренцию дорогим и сложным аналогам. По гистограмме индикатора легко определить текущую тенденцию, а так же исчерпало себя движение цены или ещё нет. Настройки индикатора аналогичны классическому
FREE
The presented indicator uses the Laguerre filter to build a classical type oscillator, similar in its appearance and method of application to the regular MACD. At the same time, this tool is much more flexible in settings compared to the usual MACD and, thanks to the Laguerre filter, is more sensitive to price movements. Laguerre Osc allows you to choose the parameters in such a way as to be effective for almost any market or time period. Both the crossing of its zero value by the oscillator and
FREE
This indicator displays the Laguerre Osc AM indicator signals on the price chart. The presented indicator uses the Laguerre filter to build a classical type oscillator, similar in its appearance and method of application to the regular MACD. At the same time, this tool is much more flexible in settings compared to the usual MACD and, thanks to the Laguerre filter, is more sensitive to price movements. Laguerre Osc allows you to choose the parameters in such a way as to be effective for almost an
FREE
This indicator displays RVI indicator signals on the chart. The main point of Relative Vigor Index Technical Indicator (RVI) is that on the bull market the closing price is, as a rule, higher, than the opening price. It is the other way round on the bear market. So the idea behind Relative Vigor Index is that the vigor, or energy, of the move is thus established by where the prices end up at the close. To normalize the index to the daily trading range, divide the change of price by the maximum r
FREE
DM Osc - Digital Momentum Oscillator.
The indicator is an oscillator based on adaptive digital filters with signals displayed both on the oscillator itself and on the price chart. The indicator provides two types of signals: When changing the direction of the oscillator line; When the oscillator line crosses the zero value. Signals are given on fully formed bars. Indicator signals require confirmation in the form of the price breaking the high/low of the bar on which the signal was sent. The i
FREE
The product is based on J.F. Ehlers' Center of Gravity indicator. Center of Gravity actually has a zero lag and allows to define turning points precisely. The indicator is a result of Ehlers' research of adaptive filters. It identifies main pivot points almost without any lag. The indicator colors candlesticks in accordance with COG data.
Parameters: Length - indicator calculation period. MaPrice - price used to calculate the indicator. Signal - indicator display options. The indicator does n
FREE

This indicator displays candle prices on the chart, colored in accordance with the data of the FATL digital filter built on closing prices. The indicator has no configurable parameters. Allows you to effectively follow the short-term trend. Usage: After the full formation of a candle colored in the opposite color to the previous candle, place a stop order at the high / low of such a candle. When the price overcomes such a high/low, a position will be opened. With the full formation of a candle p
FREE
The indicator colors candlesticks of the price chart in accordance with the data of two CCI indicators from different timeframes. If both CCI indicators are above 0, the indicator paints the candle in the color that signals about price growth, and vice versa. The indicator allows to efficiently follow the trend, track short-term price rollbacks, and also to identify price reversals. The indicator does not redraw.
Settings CCI1_Period ( >1) - period of the fast CCI osc; CCI1_Price - price of th
FREE
Digital filters are (simplified) a way to smooth data. Unlike traditional moving averages, a digital filter will be more effective in most cases. The presented indicator displays in a separate window in the form of a line the data of several (optional) digital filters built at different (optional) prices. The presented indicator is a simplified version of the Digital Filters AM indicator. The indicator does not redraw on fully formed bars. The indicator allows you to effectively follow the trend
FREE
This indicator is an implementation of the "One shot - one hit" principle. In the course of work on the creation of this product, an attempt was made to achieve the maximum balance between the sensitivity of the indicator and the effectiveness of its signals. This tool is as reliable and effective as a 45 caliber revolver, but in the same way it requires discipline and understanding of the conditions and purpose of use from its user. The indicator has only one adjustable parameter that determine
FREE
CCI Currency Strength Meter uses CCI (Commodity Channel Index) to monitor how strong a currency is, or in other words, if it's being bought or sold by the majority compared to the other currencies. If you load this indicator on a chart, it will first display the strength-lines of the currencies (base and counter currency of the chart) with changeable solid lines. Also, you can add up to ONE additional currency (only 1 for the DEMO version, but on REAL up to 5) to the "comparison pool" that alrea
FREE
Technical analysis indicator described in the article by Vladimir Kravchuk: " Digital indicators in the technical analysis of financial markets ".
In the proposed version, the indicator provides two types of signals: 1. Zero crossing; 2. Change of direction. To use it effectively, it is necessary to take into account the long-term trend and open a position only in its direction. It is recommended to use signal confirmation. A signal is considered confirmed if the current price has overcome the
FREE

This indicator is a combination of classic trend indicator and signals of the slow digital filter. The indicator has no configurable parameters. The signals are displayed on completed bars and are not redrawn. It shows high efficiency on periods less than 1 hour. The usage principle is intuitive - trade in the direction shown by the fan of moving averages. Enter once the price exceeds the High/Low of the bar where the signal was formed. Exit on the opposite conditions.
FREE
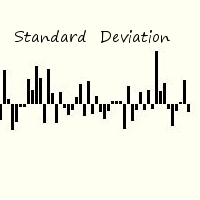
Standard deviation of returns is a popular way to view how the return of one bar relates to history. By knowing that you can better understand the magnitude of any return. The signal is calculated by taking the prior periods returns, adjusting for volatility of the returns of the last twenty periods, and dividing by the standard deviation. It is displayed in a separate panel as a histogram.
FREE
The presented indicator is a reworked version of the Moving Speed Normalized indicator, authored by Roman Kiverin . The indicator provides two types of signals: 1. The histogram crosses the zero value; 2. Change of direction by the signal line. To use it effectively, it is necessary to take into account the long-term trend and open a position only in its direction. It is recommended to use signal confirmation. A signal is considered confirmed if the current price has overcome the maximum (for
FREE

1、能显示货币之间的强弱 0是最弱 7是最强 2、能显示28个货币以及黄金 原油的 涨跌幅度 3、能切换货币对 4、能显示持仓订单的货币对 1、能显示货币之间的强弱 0是最弱 7是最强 2、能显示28个货币以及黄金 原油的 涨跌幅度 3、能切换货币对 4、能显示持仓订单的货币对 5、能利用键盘的的上下键切换货币对,左右键切换周期 1、能显示货币之间的强弱 0是最弱 7是最强 2、能显示28个货币以及黄金 原油的 涨跌幅度 3、能切换货币对 4、能显示持仓订单的货币对 5、能利用键盘的的上下键切换货币对,左右键切换周期 5、能利用键盘的的上下键切换货币对,左右键切换周期 1、能显示货币之间的强弱 0是最弱 7是最强 2、能显示28个货币以及黄金 原油的 涨跌幅度 3、能切换货币对 4、能显示持仓订单的货币对 5、能利用键盘的的上下键切换货币对,左右键切换周期
FREE

This tool helps you to control the situation at other times and include them in your trades when analyzing the market This tool scans the market and reports the movement of the market at different times With the help of this tool, you can prevent many wrong analyzes With the help of this tool, you can have an overview of the market in the shortest time and save your time
FREE
This indicator identifies the current trend, thus allowing the trader to capture a maximum of strong price movements with pending order. The indicator settings are very simple and its application is intuitive. The line serves as a strong support/resistance level depending on its location relative to the price. Individual dots of the indicator mark short-term resistance/support levels. Place pending orders to enter the market above or below (taking the spread into account) those values. The indic
FREE

Индикатор сглаженных Bollinger Bands (xBB)
Входные параметры: xBB Period - период усреднения xBB Price - используемая цена ( 0 - CLOSE | 1 - OPEN | 2 - HIGH | 3 - LOW | 4 - MEDIAN | 5 - TYPICAL | 6 - WEIGHTED) xBB Deviation - отклонение xBBColor - цвет индикаторных линий xBB Width - толщина индикаторных линиц Принцип работы
Индикатор перерассчитывает стандартный технический индикатор Bollinger Bands (дважды усредняет получаемые значения iBands). Период усреднения индикатора соответствует дв
FREE
RFTL dpl AM - (Referense fast trend line - detrended price line) indicator built on the principle of searching for discrepancies between the current real price and the calculated trend value. RFTL - a digital filter that calculates the reference line, the overcoming of which by the current price is considered a change in the short-term trend. Indicator signals: Small red dot - the price continues to fall; Small blue dot - the price continues to rise; Big red dot - the price starts to fall; Big b
FREE
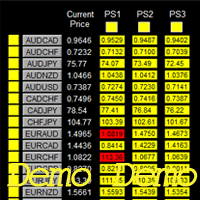
如果产品有任何问题或者您需要在此产品上添加功能,请联系我 Contact/message me if you encounter any issue using the product or need extra feature to add on the base version.
To access the full version, please re-direct to this LINK . To access the single pair version, please re-direct to this LINK . Price is likely to pullback or breakout at important support and/or resistance. This dashboard is designed to help you monitor these critical support and resistance area. Once price moves close to these important support and res
FREE

The indicator "Elvis A" is designed for a very strict determination of the reversal. With the author's settings, it is installed on the D1 chart. It will skip many signals and choose only the most reliable ones. Therefore, it is better to set it on several currency pairs.
The screenshot shows an example of this indicator in the form of an expert Advisor on a currency pair with a very large spread.
FREE

Note: this product is a free limited version of the full featured product Currency Timeframe Strength Matrix . It only includes AUD, CAD, CHF currencies instead of all 8 currencies. It includes only 5S, 1M, 5M time frames instead of all 8 (5S, 1M, 5M, 15M, 30M, 1H, 4H, 1D).
What is it? The Currency TimeFrame Strength Matrix is a simple and comprehensive Forex map that gives a snapshot of what is happening in the Forex market at the very present time. It illustrates the strength and momentum
FREE
Machine translation of the following: This indicator is used to close or open the price and time scales.Select true to display scale and false to close scale.After the price scale is closed and then opened, it may show that it is not at all. But it can be solved by switching time cycle.This indicator has two tags, D and P, which can be opened or closed in real time by clicking.The related parameters can be modified by user, such as the name, position and coordinates of the label.
FREE

***IMPORTANT: This free indicator works with the paid for Strong Weak Forex Expert Advisor. The EA also depends on the following custom indicators: Strong Weak Heiken Ashi Strong Weak Parabolic Strong Weak Symbols Strong Weak Indicator Download them for free in the Market. The EA will not work without it. These are all custom indicators which the Strong Weak Forex Expert Advisor relies on to generate trading signals. If you have any problems with installation send me a message.
FREE

***IMPORTANT: This free indicator works with the paid for Strong Weak Forex Expert Advisor. The EA also depends on the following custom indicators: Strong Weak Heiken Ashi Strong Weak Parabolic Strong Weak Values Strong Weak Indicator Download them for free in the Market. The EA will not work without it. These are all custom indicators which the Strong Weak Forex Expert Advisor relies on to generate trading signals. If you have any problems with installation send me a message.
FREE

Supporting file (2 of 2) for T3 Cloud MA
Trend indicator derived from T3 moving averages. The cloud is bounded by a fast T3 and slow T3 lines. Buying/Selling opportunities above/below cloud. The fast and slow T3 MA lines can also be used as dynamic support/resistance for more aggressive entries. Use default values for best settings. The number of look back bars is user defined. This indicator can be used in combination with other strategies such as price action. Suitable for all time frames. P
FREE

The purpose of this new version of the MT4 standard indicator provided in your platform is to display in a sub-window multiple timeframes of the same indicator. See the example shown in the picture below. But the display isn’t like a simple MTF indicator. This is the real display of the indicator on its timeframe. Here's the options available in the FFx indicator: Select the timeframes to be displayed (M1 to Monthly) Define the width (number of bars) for each timeframe box Alert pop up/sound/ema
FREE

Индикатор выводит первые производные двух MACD. По умолчанию, желтая MACD является более быстрой, чем синяя MACD. В настройках можно задать подходящие вам параметры для каждой из MACD. Одновременное изменение знака производных может являться дополнительным сигналом разворота. Входные параметры
Yellow MACD fast EMA period Yellow MACD slow EMA period Blue MACD fast EMA period Blue MACD slow EMA period
FREE

Adaptive MA is a simple modification of the moving averages (MAs) that allows displaying an average value line based on multiple MAs on the chart. The parameters allow you to set any number of MA periods. The number of parameters is equal to the number of moving averages applied in calculation.
At first, it may seem that nothing new has been invented and there is no sense in this approach. However, this impression is deceptive. As we know, the trends have different duration. Have you ever tried
FREE

GBP INDEX
The Currency Index Project is ONE part of a thorough Forex study. Many people do not know the theoretical basis that drives currency exchange rates to move on the market. With this set of tools you will be able to have a more complete view of the entire market by analyzing not only the single currency of an exchange, but all the exchange rates that make up that currency by looking at a single window!
The indicator faithfully represents the real index of a single currency present in
FREE

This indicator calculate the minimum,maximum,average and relative (to points of the bar) spread in the chart applied period. The indicator must be applied to one or more different period on a Pair and analyze the spread for all the Pairs available by the Broker. The csv output for one minute chart is something like this https://gofile.io/?c=K5JtN9 This video will show how to apply the indicator https://youtu.be/2cOE-pFrud8 Free version works only for GBPNZD
FREE

An indicator showing volumes with the addition of four moving averages of these volumes. What is this indicator for? When analyzing the Forex markets, metals, indices on the H1, H4 charts, at the beginning of the day and at the end of the trading day according to server time, the volumes are less than in the middle of the day. This indicator was created for this. It will help you compare trading volumes within the day. The indicator is distributed as is. Tags: Volume, Custom Volume, MA, Custom M
FREE

This indicator will turn the colors of your candles into a trend oriented colored showing 4 different colors based on two moving averages and the slope of the slow moving average. very powerful indicator for all periods of time showing you the direction of the trend to confirm your trades.
Green: Bullish
Dark Green: Bullish Weak
Light red: Bearish Weak
Red: Bearish
For more info:
https://linktr.ee/trader_1st
FREE
This indicator allows to hide moving average (on all MT4 timeframes) from a date define by the user with a vertical line (Alone) or a panel (with "Hidden Candles"). Indicator Inputs: MA Period MA Shift MA Method MA Apply To Information on "Moving Average" indicator is available here: https://www.metatrader4.com/en/trading-platform/help/analytics/tech_indicators/moving_average ************************************************************* Hey traders!! Give me your feeds! We are a community h
FREE

This is a trend following indicator that identifies optimal entry points in the direction of a trend with an objective stop loss to manage the trade. The indicator allows you to catch trend early and ride it. The Indicator draws resistance line as it detects an Uptrend and draws support line when it detects a Downtrend on the chart. When those levels are broken, that allows you to identify the Trend Direction and Momentum in the direction of prevailing trend which offers optimal entry points in
FREE

Not everyone can write an indicator. But anyone can have an idea. The indicator Universal Main Window Free , which takes as an input parameter the formula by which the indicator line will be drawn, will help to implement it. This indicator is intended for use in the main chart window.
All indicators of the series Universal :
Main window Separate window Free MT4 Universal Main Window Free MT5 Universal Main Window Free MT5 MT4 Universal Separate Window Free MT5 Universal Separate Window Free
FREE

EUR INDEX
The Currency Index Project is ONE part of a thorough Forex study. Many people do not know the theoretical basis that drives currency exchange rates to move on the market. With this set of tools you will be able to have a more complete view of the entire market by analyzing not only the single currency of an exchange, but all the exchange rates that make up that currency by looking at a single window!
The indicator faithfully represents the real index of a single currency present in
FREE

***IMPORTANT: This free indicator works with the paid for Strong Weak Forex Expert Advisor. The EA also depends on the following custom indicators: Strong Weak Heiken Ashi Strong Weak Parabolic Strong Weak Values Strong Weak Symbols Download them for free in the Market. The EA will not work without it. These are all custom indicators which the Strong Weak Forex Expert Advisor relies on to generate trading signals. If you have any problems with installation send me a message.
FREE

The Toronto Stock Exchange Session's Hours
This indicator facilitates observing the currency pair's quotations during subsequent parts of the stock exchange session live. Before the session starts, a rectangle is drawn on the chart but not filled in with color. It means the extent of the session duration. Before the first bar enters the rectangle of the session, a sound signal or pop-up window will notify us that the session will just start. When the price graph crosses the edge of the sessio
FREE

LyfUD指标专门 为黄金设计的趋势指标 ,也可以用于任何金融工具。用于及时反映多空力量,由U线和D线组成, 波动以0为中轴偏离运行, U线为快线D线为慢线。 LyfUD指标可以和 绝大多数策略结合使用 ,能够更加有效的把握风控。 U线和D线采用价格行为市场追踪算法,能及时反映市场方向, 可用在任意货币。 特性: 1. U线、D线在0轴上方,买入信号参考。 2. U线、D线 在0轴下方 ,卖出信号参考。 3. U线、D 线极限背离转向,行情可能出现反转。 4. 滞后性低,能及时反映趋势。 致力于结合其他指标,LyfUD和 均线、Pinbar 等搭配使用能迅速找到一些合理的关键位。 LyfUD只作为参考依据,其风险与作者无关。未经作者同意,禁止他售。
FREE

Adaptiv Ma это индикатор средняя линия значение которой выставляется в меню и применяется на тейфрейме Н4. В последствии она адаптируется к выбранному определенному таймфрейму. В меню индикатора задаются следующие параметры 1. Период индикатора 2.Метод определения Ма. 3. Стиль Ма. 4.Толщина линии Ма. 5.Цвет линии Ма.
При переключении между таймфреймами автоматически переключается значение периода Ма для адаптации к новому таймфрейму. Пишите насколько вам была полезен такой индикатор.
FREE

Индикатор " AutoDiMA " рисует по графику в основном окне скользящую среднюю с динамическим периодом, рассчитываемым по стандартному индикатору " Average True Range (ATR) ". Когда " ATR " изменяется в диапазоне значений между верхним уровнем и нижним уровнем - тогда в заданном диапазоне меняется вариативный период скользящей средней. Принцип ускорения или замедления скользящей средней переключается в настройках параметром " FLATing ".
ВХОДНЫЕ ПАРАМЕТРЫ: - DRAWs : Количество баров для отображени
FREE

This indicator shows the value of returns in the selected time frame .
They are calculated as logarithm of returns , rather than price or raw returns. For small returns, arithmetic and logarithmic returns will be similar. The benefit of using returns, versus prices, is normalization. It is possible measures all variables in a comparable metric despite originating from price series of unequal values.
Inputs You can display data both as a Histogram or a Line It's also possible to display
FREE

AUD INDEX
The Currency Index Project is ONE part of a thorough Forex study. Many people do not know the theoretical basis that drives currency exchange rates to move on the market. With this set of tools you will be able to have a more complete view of the entire market by analyzing not only the single currency of an exchange, but all the exchange rates that make up that currency by looking at a single window!
The indicator faithfully represents the real index of a single currency present in
FREE
REI Osc is an indicator that measures the rate of price change and signals overbought/oversold conditions if the price shows weakness or strength. The indicator was developed by Tom DeMark and described in the book Technical Analysis - The New Science. The indicator value changes from -100 to +100. REI is an improved oscillator as it attempts to remain neutral in a sideways trend and only shows signals when a significant top or bottom has been reached. Tom DeMark suggests using a default period
FREE

The Bombay Stock Exchange Session's Hours
This indicator facilitates observing the currency pair's quotations during subsequent parts of the stock exchange session live. Before the session starts, a rectangle is drawn on the chart but not filled in with color. It means the extent of the session duration. Before the first bar enters the rectangle of the session, a sound signal or pop-up window will notify us that the session will just start. When the price graph crosses the edge of the session
FREE

The Hong Kong Stock Exchange Session's Hours
This indicator facilitates observing the currency pair's quotations during subsequent parts of the stock exchange session live. Before the session starts, a rectangle is drawn on the chart but not filled in with color. It means the extent of the session duration. Before the first bar enters the rectangle of the session, a sound signal or pop-up window will notify us that the session will just start. When the price graph crosses the edge of the sess
FREE

This pointer is supplied of a double smoothing in such way to succeed to be more reactive of a blunt Moving Average but without tracing the noises of bottom of the market. Its use will have to be exclusively turned to the search and to the identification of the trend in action (even if graphically it could seem an indicator that indicates an inversion of the prices) because the first useful signal is had to the opening of the successive bar to that one that has made to invert the sense of the
FREE
Version History Date Version Changes 07/09/2022 1.10 Initial released Description The RedeeCash RSI is your typical RSI indicator with the three latest RSI calculations exposed as global variables for easier integration with scripts and expert advisors. Code Sample To invoke this indicator from an EA or script, call the iCustom metatrader function, iCustom ( Symbol (), PERIOD_CURRENT , "Market/RedeeCash RSI" , 14 , 1 , 0 ); string RSIVarName = StringConcatenate ( Symbol (), "_rsi" ); string RSIP
FREE
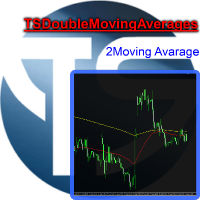
Useful indicator that incorporates two moving averages, for your favorite trading strategy. Moving averages are fully configurable, Period, Method, Color, Etc Just place it on your favorite timeframe.
The benefits you get : Never redesigns, does not retreat, never recalculates. Works on forex and CFD, timeframe from M1 to Monthly. Easy to use. Convenience for your trading.
FREE

CHF INDEX
The Currency Index Project is ONE part of a thorough Forex study. Many people do not know the theoretical basis that drives currency exchange rates to move on the market. With this set of tools you will be able to have a more complete view of the entire market by analyzing not only the single currency of an exchange, but all the exchange rates that make up that currency by looking at a single window!
The indicator faithfully represents the real index of a single currency present in
FREE

NZD INDEX
The Currency Index Project is ONE part of a thorough Forex study. Many people do not know the theoretical basis that drives currency exchange rates to move on the market. With this set of tools you will be able to have a more complete view of the entire market by analyzing not only the single currency of an exchange, but all the exchange rates that make up that currency by looking at a single window!
The indicator faithfully represents the real index of a single currency present in
FREE

This indicator displays the moment when the TTF oscillator crosses the zero value, and the moment when the TTF oscillator crosses its smoothed value. Crossing the zero value by the TTF oscillator is a buy/sell signal. If the TTF oscillator crosses its smoothed value, it is a signal of a trend change. The signal is given after the end of the formation of the candle. The signal is confirmed when the price crosses the high/low of the bar on which the signal was given. The indicator does not redraw.
FREE
This indicator displays the moment when the TTF oscillator crosses the zero value, and the moment when the TTF oscillator crosses its smoothed value. Crossing the zero value by the TTF oscillator is a buy/sell signal. If the TTF oscillator crosses its smoothed value, it is a signal of a trend change. The signal is given after the end of the formation of the candle. The signal is confirmed when the price crosses the high/low of the bar on which the signal was given. The indicator does not redraw.
FREE

The presented indicator is a moving average based on the fast digital filter (FATL) data. Using the indicator is similar to using a standard moving average: For small values of the period of the moving average (1-10): Buying/selling is carried out at the moment of changing the direction of the moving average (after the price has overcome the high/low of the bar on which the change of direction occurred). For large values of the period of the moving average: Buying / selling is carried out de
FREE

This indicator is a combination of classic trend indicator and signals of the slow digital filter. The indicator has no configurable parameters. The signals are displayed on completed bars and are not redrawn. It shows high efficiency on periods less than 1 hour. The usage principle is intuitive - trade in the direction shown by the fan of moving averages. Enter once the price exceeds the High/Low of the bar where the signal was formed. Exit on the opposite conditions.
FREE
This indicator displays candle prices on the chart, colored in accordance with the data of the SATL digital filter built on closing prices. The indicator has no configurable parameters. Allows you to effectively follow a long-term trend. Usage: After the full formation of a candle colored in the opposite color to the previous candle, place a stop order at the high / low of such a candle. When the price overcomes such a high/low, a position will be opened. With the full formation of a candle pain
FREE

This indicator recognizes over 30 Japanese Candlestick Patterns and highlights them beautifully on the chart. It is simply one of those indicators price action traders can't live without. Boost your technical analysis overnight Detect japanese candlestick patterns easily Trade reliable and universal reversal patterns Hop onto established trends safely using continuation patterns The indicator is non-repainting and implements alerts The indicator implements a multi-timeframe dashboard It detects

The indicator detects the following types of Japanese candlesticks: Doji, Hammer and/or Hanging Man, Shooting Star and/or Inverted Hammer, Spinning Top, Maribozu. The indicator is intended for manual and/or automated trading within an Expert Advisor. There is a possibility to choose colors for bullish and bearish candlesticks. For automated trading, use any indicator buffer of the double type: 0, 1, 2 or 3, whose value is not zero!

The indicator is intended for detecting big (long) and/or small (short) candlesticks. There is possibility of coloring the bullish and bearish candlesticks. The indicator can be used for manual and/or automated trading within an Expert Advisor. The indicator data that can be used for automated trading can be taken from one of four buffers of the double type: 0, 1, 2 or 3. Values must not be equal to zero.

The indicator of DeMark fractals. The indicator can be drawn on the basis of price data and on the basis of a moving average. There is a possibility to color the up and down fractals. The indicator can be used for manual and for automated trading within an Expert Advisor. For automated trading, use any indicator buffer of the double type: 0 - up fractals, 1 - down fractals! Values of the buffers must not be equal to zero. A moving average is drawn on the basis of input parameters: Calc_Method

Description A universal colored indicator Stochastic. The rising and falling lines and the levels of the indicator can be colored. The indicator can be calculated as the standard one on the basis of a price or as a derivative on the basis of the following nineteen other indicators included in the standard package of the MetaTrader 4 terminal: AD - an indicator of accumulation and distribution of volume. OBV - On Balance Volume. Volume - tick volume indicator. AC - indicator of acceleration. AO

Description A universal colored indicator MACD Histo. The rising and falling of the indicator histogram can be colored. The indicator can be calculated as the standard one on the basis of a price or as a derivative on the basis of the following twelve other indicators included in the standard package of the MetaTrader 4 terminal: AD - an indicator of accumulation and distribution of volume. OBV - On Balance Volume. Volume - tick volume indicator. Force - Force Index indicator. MFI - Money Flow

Description A colored universal indicator MACD Line (MA convergence-divergence indicator, shown as a histogram). The rising and falling of the indicator histogram can be colored. The indicator can be calculated as the standard one on the basis of a price or as a derivative on the basis of the following twelve other indicators included in the standard package of the MetaTrader 4 terminal: AD - an indicator of accumulation and distribution of volume. OBV - On Balance Volume. Volume - tick volume i

Trend Trading is an indicator designed to profit as much as possible from trends taking place in the market, by timing pullbacks and breakouts. It finds trading opportunities by analyzing what the price is doing during established trends. [ Installation Guide | Update Guide | Troubleshooting | FAQ | All Products ]
Trade financial markets with confidence and efficiency Profit from established trends without getting whipsawed Recognize profitable pullbacks, breakouts and early reversals The ind

Description A universal indicator RSI together with moving averages based on it. Depending on the need, moving averages can be disabled. You can color the indicator lines and levels: lines of RSI, moving average lines and thresholds of overbought and oversold levels. The indicator can be calculated as the standard one on the basis of a price or as a derivative on the basis of the following eighteen other indicators included in the standard package of the MT4 terminal: AD - an indicator of accu
MetaTrader 마켓 - 거래자를 위한 로봇 및 기술 지표는 거래 터미널에서 바로 사용할 수 있습니다.
The MQL5.community 결제 시스템은 MQL5.com 사이트의 모든 등록된 사용자가 MetaTrader 서비스에서 트랜잭션을 수행할 수 있습니다. 여러분께서는 WebMoney, 페이팔, 또는 은행 카드를 통해 자금을 예치하거나 인출하실 수 있습니다.
트레이딩 기회를 놓치고 있어요:
- 무료 트레이딩 앱
- 복사용 8,000 이상의 시그널
- 금융 시장 개척을 위한 경제 뉴스
등록
로그인
계정이 없으시면, 가입하십시오
MQL5.com 웹사이트에 로그인을 하기 위해 쿠키를 허용하십시오.
브라우저에서 필요한 설정을 활성화하시지 않으면, 로그인할 수 없습니다.