MetaTrader 4용 기술 지표 - 104

The indicator determines the strength of the trend and its possible reversal points, based on the author's arithmetic approach .
Each new peak or trough is a trend development. Such peaks and troughs are numbered so that the strength of the trend development can be seen. Attempts to change the trend are also numbered. This gives an understanding of a possible change in the direction of the trend. Indicator signals are generated when trying to change the trend .
In the settings, it is possib

The QRSI indicator is one of the most important and well-known indicators used by traders around the world. By its nature, the QRSI indicator is an oscillator, that is, it fluctuates in a certain zone, limited by the maximum (100) and minimum (0) values. Specifically, this indicator works according to an accelerated algorithm, but this is not its only difference. This indicator implements a more advanced calculation based on the Relative Strength Index algorithm. The peculiarity of the implemen

Moving average, moving average (English Moving average, MA) is a general name for a family of functions, the values of which at each point of determining the level of some average value of the original function for the previous period.
CalcPipsOn - In order to add rozruhunok on the chart, you must activate this field.
The previous development of a variant of this indicator differed in that it had an extended functionality for calculating averaging in the set, as well as advanced possibili

The indicator checks the trend and draws arrows in the direction of the transaction.
Recommended parameters are set by default.
The Signal mode parameter is responsible for confirming the signal. Live - signal without confirmation On bar close - confirmation signal after closing the current candle (non-repainting)
The indicator is designed for any pairs. Recommended pairs:
EURUSD, AUDUSD, USDCAD, USDCHF, USDJPY, NZDUSD, GBPUSD

Индикатор содержит 3 RSI с возможностью выбора рабочего таймфрейма, периода и параметра сглаживания каждого. Не перерисовывает начиная с 1 бара. При задании параметра сглаживания большего 1 показания будут обработаны специальным образом, для исключения мелких колебаний. Возможно использовать в качестве готовой торговой системы, где показания старших ТФ определяют тренд, а младший используется для поиска точек входа, в качестве примера может служить система Дмитрия Брылякова https://www.infoclub
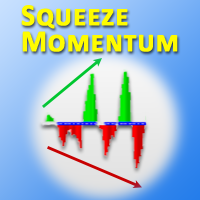
This is the MetaTrader version of the very popular Squeeze Momentum indicator. It is based of of John Carter's TTM Squeeze volatility indicator, as discussed in his book Mastering the Trade. With this version you can enable notifications when a squeeze is released (push notification, email, or pop-up message). Strategie
Grey dots indicates a squeeze in the current timeframe. Blue dots indicates that the squeeze is released. Mr. Carter suggests waiting till the first blue dot after
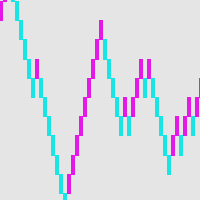
브릭 다이어그램 - 대체 거래 방법 수많은 차트의 촛대에 혼란스러워하는 트레이더이거나 선을 그리는 방법이나 지지선과 저항선을 그리는 방법을 모른다면 이때 자신에게 맞는 다른 거래 방법을 찾아야 합니다. 운전자가 반복적으로 문제를 만난 후 전면 점검을 위해 정지하는 것처럼 거래에서도 마찬가지입니다. 브릭 차트는 장중 거래자에게 간단한 거래 방법을 제공합니다.실제로 이 방법은 K-라인과 동일한 역사를 가지고 있으며 일본에서도 시작되었습니다. 브릭 차트를 정의하기 위해 세트 포인트 또는 베이시스 포인트의 가격 추세만 설명합니다. 예를 들어, 10포인트 브릭 차트는 가격 변화의 10포인트 상승 추세 또는 10포인트 하락 추세만 나타낼 수 있습니다. 브릭 다이어그램은 가격이 시간에 얽매이지 않는다는 독특한 장점이 있습니다. 즉, 가격 변동이 설정 값에 도달했을 때만 새로운 브릭 다이어그램이 나타나고 브릭 다이어그램이 가격 Burr를 제거하므로 감각에서 매우 편안합니다.
스마트 볼륨 추적기와 결합: https://www.mql5.com/en/market/product/116650
발자국 차트와 결합: https://www.mql5.com/en/market/product/94153
지역 내 거래와 결합: https://www.mql5.com/en/market/product/110194
VOLUM DAY TRADER와 결합: h https://www.mql5.com/en/market/product/72498
주문서와 결합: https://www.mql5.com/en/market/product/102247
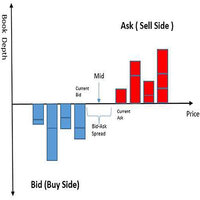
레벨 2 트레이딩은 MetaTrader 차트에서 현재 매수 및 매도 거래량을 시각화하는 데 도움이 되는 지표입니다. 이는 시장에서 구매 및 판매 활동을 빠르게 파악하여 압력이 가해지는 위치를 이해할 수 있는 것과 같습니다.
그것이 보여주는 것 입찰 및 매도 금액: 표시기는 매수(매수) 및 매도(매도) 거래량을 보여주는 라벨을 표시
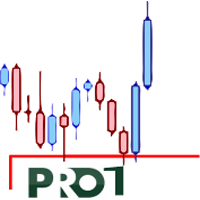
This indicator gives you a valid level The rules of trading with this indicator are like the rules of price action This level is broken only with a long bar candle or a pullback This level is valid in all time frames If you have a sharp downward or upward trend, the trend will end when the price reaches this level This is my first indicator that I put in the store and I will put some very professional indicators soon
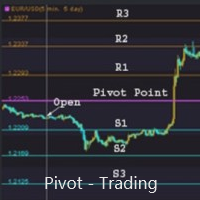
支点交易 : 1.pp 支点 2. r1 r2 r3 , s1 s2 s3 交易实用必备工具指标 波浪自动计算指标,通道趋势交易 完美的趋势-波浪自动计算通道计算 , MT4版本 完美的趋势-波浪自动计算通道计算 , MT5版本 本地跟单复制交易 Easy And Fast Copy , MT4版本 Easy And Fast Copy , MT5版本 本地跟单复制交易 模拟试用 Easy And Fast Copy , MT4 模拟账号运行 Easy And Fast Copy , MT5 模拟账号运行
支点( pivot points) 作为一种交易策略已经很长时间了,最初是场内交易员使用这种方法。使用这种方法通过几个简单的计算就可以了解市场在一天中的去向。 支点法中的支点是一天中市场方向的转向点,通过简单地计算前日的高点、低点和收盘价,可以得到一系列点位。这些点位可能形成关键的支撑和阻力线。支点位,支撑和阻力位被统称为支点水位。 你所看到的市场每天都有开盘价、高价、低价及收盘价(有一些市场是 24 小时开盘,比如外汇市场,通常用 5pm EST 作为开盘和收盘时间)。这些信

BEHOLD!!!
One of the best Breakout Indicator of all time is here. Multi Breakout Pattern looks at the preceding candles and timeframes to help you recognize the breakouts in real time.
The In-built function of supply and demand can help you evaluate your take profits and Stop losses
SEE THE SCREENSHOTS TO WITNESS SOME OF THE BEST BREAKOUTS
INPUTS
MaxBarsback: The max bars to look back
Slow length 1: Period lookback
Slow length 2: Period lookback
Slow length 3: Period lo

이 표시는 XAU/USD, 1분 차트 전용입니다. 모든 쌍에는 고유한 특성과 가격 변동이 있습니다.
이 지표로 V자형 반전을 거래하십시오. 두피는 후행 정지를 사용하여 매수하고 뉴스는 더 극단적이고 갑작스러운 매도를 유발할 수 있으므로 뉴스를 피합니다.
백테스트에서 1분 시간 프레임에 연결하고 반전 매수를 확인합니다. 표시기는 다시 그리거나 다시 계산하지 않습니다.
활성 시간에만 거래
이 표시는 XAU/USD, 1분 차트 전용입니다. 모든 쌍에는 고유한 특성과 가격 변동이 있습니다.
이 지표로 V자형 반전을 거래하십시오. 두피는 후행 정지를 사용하여 매수하고 뉴스는 더 극단적이고 갑작스러운 매도를 유발할 수 있으므로 뉴스를 피합니다.
백테스트에서 1분 시간 프레임에 연결하고 반전 매수를 확인합니다. 표시기는 다시 그리거나 다시 계산하지 않습니다.
활성 시간에만 거래

The Golden Target Indicator is a forex trading tool that displays important market levels on the charts. These levels include: buy and sell areas, overbought and oversold levels, extreme levels, reversal levels and middle level. The price will most likely react at these levels so plan your forex trades accordingly. The Golden Target Indicator fits all kinds of timeframes and currency pairs. It is displayed directly on the main trading chart. The default settings can be modified directly fr

This is based on short term strength or weakness and not on moving averages. Moving averages are used for filter only. Trade supply and demand with arrows. Supply and demand breakouts and strength of the buyers or sellers . Don't trade buy arrow to sell arrow. Trade the strength with trendlines or moving averages and use stops. The arrow can have some strong moves. Trade on all time frames. Try it out in the back tester. The pips can be made with this indicator, follow the arrows and mak

Backtesting notes! - Please download all history data for cross mulit-timeframe, otherwise it won't work.
More info about backtest https://www.youtube.com/watch?v=HZTJQX5tOsk
SharpEntry version 2.3 - Adjust signals for each Timeframes structure.
- Allow to attach the indicator only Timeframes M1, H1, D1 for a better detection of the signal.
- Resolve a little repaint on a current price.
SharpEntry version 2.0 - Support trending mode.
- Increase arrow size.
- Fix arrow icon floatin

this indicator is the way to get success entery point it give you the movement of market this indicator build base on Artificial intelligent of mix algorithms
work on all time frames and all pairs important thing you need to take alook on the signals on high time frame then apply the signals of lowest time frame (always take the first Arrow after close the candle on the chart )
example if you want enter order on H1 time frame go take alook on D1 time frame and see the signalsit will te

Market structures, Market balance, Range breakouts This tools helps to identify areas of market ranges, structures and plots colored boxes on breakout of those areas. User is given the option to receive alerts and notifications on the formation of the blocks. The tool has the ability to become an essential part of a technical trading system or even pure price action trading. Usage:- An essential tool for price action or technical traders. More information in the blog

Horizontal volume bars, Cluster analysis, Volume profile Volume in Range gets information about the accumulated volume in a specified vertical range and period in bars. The received data is then plotted on the chart as rectangular boxes with the volume quantity inside. Usage:- The tool acts as a support resistance levels but most importantly it should be used to check in which direction the price breaks out of the significant levels formed by this indicator and then actions to be taken on correc
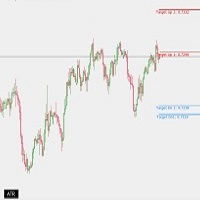
ATR Level button An helpful utility with a button to Show/Hide ATR Levels.
Configurations: https://ibb.co/2j9fTGL - ATR Period: The Length of ATR to calculate - Choose Color for R1/R2: Line color for each probability Resistance Level - Choose Color for S1/S2: Line color for each probability Resistance Level - chart btn_corner: Choose the corner of the button to appear - Button Text: Caption of Button - Button Font/Size: configure Font and size of button text - btn_background_color: Backgroun
multi timeframe moving average indicator will give you the right Direction of the market on the higher time frame according to the setting of moving average (Displays a higher timeframe moving average on a lower timeframe chart) MA Timeframe should be greater or equal to the chart timeframe working on all pairs and on all timeframe you can use it in scalping or intraday or swing
Candle Arrow indicator give you the power of the candle when you see the Arrow on Chart that mean a price Action will happen soon so important thing you must draw the supply and demand area on the chart and the wait the Signal Appear with Candle you must wait until candle close and i advice you take look on higher timefram then back to smaller timeframe it will give you a good entry point

Forex Indicator Price Movement Level with Trend Alerts. This indicator will write value degrees of the latest position of price at the current Timeframes according to the Daily price movement, and when position and condition of trend status was changed the indicator will give an alerts. you can depend on this indicator to take order with strong entry point and good level of movement

Ing (inguz,ingwar) - the 23rd rune of the elder Futhark ᛝ, Unicode+16DD. Add some runic magic to your trading strategies. The correct marking of the daily chart will indicate to you the successful moments for counter-trend trading. Simple to use, has high efficiency in volatile areas. Be careful in lateral movements.
Signals ᛝ are generated when the main lines of construction intersect.
Red arrow down - recommended sales
Blue up arrow - recommended purchases
rare purple arrows indicate

The Driver trend technical indicator is used to analyze price movements in the Forex market. It is included in the so-called arrow indicators. And it is very practical in that it forms arrows in places where buy signals appear, or, conversely, sell signals.
The indicator helps to analyze the market at a selected time interval. He defines the mainstream. The Driver trend indicator makes it possible to classify the direction of price movement by determining its strength. Solving this problem he

The Others indicator is a trend-type indicator. In those moments when you need to make a decision to enter a position and give the trader a direction. The indicator gives the trader the opportunity to visually determine which trend will be present at a particular time interval. These are auxiliary tools for technical analysis of the market. Recommended for use in conjunction with any of the oscillators.
The main application of the Others indicator is to generate buy and sell signals. Determin

Signal Finding is a trend indicator, a technical analysis tool that helps to determine the exact direction of a trend: either an upward or a downward movement of the price of a trading instrument. Although these indicators are a little late, they are still the most reliable signal that a trader can safely rely on. Determining the market trend is an important task for traders. With this indicator, you can predict future values. But the main application of the indicator is to generate buy and sel

The Spurts trend indicator is used to determine the strength and direction of a trend and to find price reversal points.
The trend can be ascending (bullish) and decreasing (bearish). In most cases, the trend grows for a long time and falls sharply, but there are exceptions in everything. The price movement can be influenced by economic and political news. A trend is a stable direction of price movement. To find it, the indicator uses calculations designed to smooth out sharp fluctuations tha

Haine is a reversal indicator that is part of a special category of instruments. The indicator not only analyzes the price movement, but also indicates the points of possible reversals. This facilitates fast and optimal opening of buy or sell orders (depending on the current situation). In this case, the historical data of the analyzed asset must be taken into account. It is the correct execution of such actions that largely helps traders to make the right decision in time and get a profit.
T

Signal Alien is a handy tool if you are used to trading on a clean chart, but sometimes you need to take a look at this indicator. That is, everything is as simple as possible, positions are closed in the opposite way, that is, as soon as a signal is received to open an order in the direction opposite to your position. For example, you opened a long position (sell), close it when a red arrow appears pointing down.
If you are not sure how to determine the inflection point of the trend and are

I suggest that everyone who is interested in the Smoking indicator try to trade.
Smoking is a technical analysis tool that uses mathematical calculations to determine various aspects of price movement and is based on historical data. Smoking reveals special aspects of price movement and allows traders to make the right decision. All trading indicators analyze the price from different angles based on historical data. Therefore, it is not entirely correct to say that they can predict the future

Master scalping with this indicator. Trade on any time frame for scalps on buy or sells. Follow trends using a 200 moving average and stops and targets. Use with your own system. This indicator can give pips if following it correctly. Stick to rules and pick up pips daily. Use as entries in a trend, scalp for a few pips or exit on opposite signal. Best to follow higher time frame trends. Indicator doesn't repaint or recalculate. Rules: Don't trade overnight, only trade during active sessi

Use Stochastic Oscillator (STO) Oversold and MACD < 0 show buy signal Use Stochastic Oscillator (STO) Overbought. and MACD > 0 show sell signal
Please check support resistance before opening an order. This indicator is only a helper. Can't tell you 100% right.
"Selling pigs" is a trivial matter. "Sticking on a mountain" is a challenge. Thanks you. welcome.
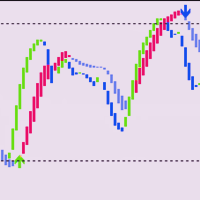
Necessary for traders: tools and indicators Waves automatically calculate indicators, channel trend trading Perfect trend-wave automatic calculation channel calculation , MT4 Perfect trend-wave automatic calculation channel calculation , MT5 Local Trading copying Easy And Fast Copy , MT4 Easy And Fast Copy , MT5 Local Trading copying For DEMO Easy And Fast Copy , MT4 DEMO Easy And Fast Copy , MT5 DEMO
Auxiliary indicators It wait s for the hunt, waits for the price limit to appear, waits for
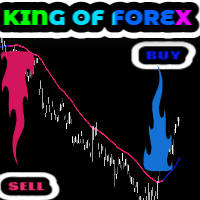
King of Forex trend indicator is a trend following indicator based on moving averages. This indicator doesn't repaint. The major function of this indicator is to show the major direction of the trend, the beginning and the end of the current trend. A bullish trend is when the indicator turns blue A bearish trend is when the indicator turns pink. This indicator is great for swing trading and day trading It works best on H1, H4, D and Weekly time-frames. It works on all pairs but it works best on

This indicator is good for small time frames like 1 and 5 minutes and made for day trading. The indicator never repaints or recalculates. The indicator works is for trading swing points in day trading, following bulls or bears. Its a simple to use, non cluttered indicator with a high success rate. This indicator works well to capture ranges. All indicators come with limitations and no indicator or system is always accurate. Use money management for long term trading success. Place in backte

This indicator is designed based on Mr. WD Gann's square of nine methods.
Using this indicator, we can enter the desired pivot price and, based on the coefficient we assign to it, extract 8 support and resistance numbers with 8 angles of 45, 90, 135, 180, 225, 270, 315, and 360.
Calculates 8 support and resistance points and draws support and resistance lines.
The coefficient is to triple the number of executions.
To select pivot points in which a price is a lar

The new update makes this indicator a complete tool for studying, analyzing and operating probabilistic patterns. It includes: On-chart Multi-asset percentage monitor. Configurable martingales. Twenty-one pre-configured patterns , including Mhi patterns and C3. An advanced pattern editor to store up to 5 custom patterns. Backtest mode to test results with loss reports. Trend filter. Hit operational filter. Martingale Cycles option. Various types of strategies and alerts. Confluence between patte
a tool for working with binary options well identifies the trend and possible market reversals
can be used for forex scalping
it works very well on binary options if used with oblique levels or wave analysis, it will be a good assistant in determining the entry point
recommended expiration time from 1-15 depending on the selected timeframe
the next update will add the ability to customize the tool.

This is a multi-timeframe multi-currency Fibo (Fibonacci levels) and Pivots scanner which also shows Missed Pivot count and Fibo Golden Ratio Zones. Select separate Pivot Timeframes for each Dashboard Timeframe Check when price is near a Pivot point Check for Price Crossing Pivot Point Use Mid Pivots (Optional) Show Missed Pivots (Optional) Show High Volume Bar Use Fibo (Optional) Use Fibo Golden Ratio (Optional) Set your preferred Timeframe for Fibo or Pivots
Check out Common Scanner Settin

Moving Wizard indicator will guide you to work with Trend and give pure Entry point depending on crossing on the chart it work on all currency and all Timeframe you can use it daily or scalping or swing its good with all and This indicator you can make it your strategy i work on it on H1 Timframe and make a good money you can take alook on it and you see a great resault on chart .Gold moving is to Know the Trend of price other moving below it mean we looking to sell orders . if above it we loo
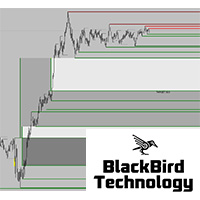
New market liquidity indicator, more accurate with two levels, will really unhide the "hidden agenda" of the price action in any timeframe. For more information about market liquidity, a manual on how to use this indicator please send me a message.
A lot of information can be found on the net. (search liquidity trading/ inner circle trader)
https://www.youtube.com/watch?v=yUpDZCbNBRI
https://www.youtube.com/watch?v=2LIad2etmY8& ;t=2054s
https://www.youtube.com/watch?v=wGsUoTCSitY& ;t

This is the DayTradeKing for gold on a 1 minute time frame. It is a different calculation for the range. Use a 200 period moving average as a filter. Always use stops and avoid news, wait for more conformation. This looks to capture intraday ranges. Put it in the back tester on 1 minute to see the price action and how it works. Trade with trend Use filter Use stops Alerts are added for pop ups and sound.

RSI Scanner Plus Indicator scans RSI values in multiple symbols and timeframes. Plus trend line buffer on the chart. Features:
-Trend Line : We add trend line on the chart in the hope it help you to see current trend on the chart while following oversold and overbought from RSI. This is additional feature in the indicator. We consider that following the trend is very important in trading. -Changeable Panel Display : Change the value of Max.Symbols/Panel and the indicator will adjust the d
정규화된 추세 반전 다중 시간 프레임 표시기 정규화된 추세 반전 다중 시간 프레임 표시기는 매우 안정적인 추세 반전 표시기로 개발되었습니다. 정규화된 추세 반전 다중 시간 프레임 표시기는 모든 외환 통화 쌍 및 금속에 적합하며 모든 종류의 시간 프레임 차트와 일치할 수 있습니다. 정규화된 추세 반전 다중 시간 프레임 표시기는 별도의 창에서 두 개의 수정된 이동 평균 시스템의 교차를 사용하여 신호를 생성합니다. 이러한 평균 수준을 정규화된 추세 반전 다중 시간 프레임 표시기라고 합니다. 파란색 평균 수준을 빠른 정규화 추세 반전 다중 시간 프레임 표시기라고 하고 느린 정규화 추세 반전 다중 시간 프레임 표시기를 빨간색 평균 수준으로 표시합니다. 빠른 파란색 정상화 추세 반전 다중 시간 프레임 표시기가 느린 빨간색 정상화 추세 반전 다중 시간 프레임 표시기를 교차할 때마다 시장에 매수 진입을 알리는 강세 크로스오버로 간주됩니다. 반면에 느린 빨간색 정규화 추세 반전 다중 시간 프


Breakout strategies are very popular among traders. They consist of buying an asset when it breaks above some level or selling it when the price breaks below some level. This level can be a t rend line, a previous high, a m oving average, or another indication. In the case of a box breakout, the indicator draws a box containing the highs and lows of the previous candles. LONDON BREAKOUT BOX indicator gives u alert when there is a box break out ONLY IN LONDON session when price breaks previo
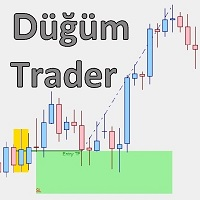
Düğüm Trader는 R&D 팀의 점진적 가격 조치 방법을 기반으로 개발되고 개발된 진입 구역 감지기 및 거래 제안 지표입니다. 이 도구는 거래자가 잠재적인 지원 및 저항 구역으로 범위 영역을 더 깊이 볼 수 있도록 도와줍니다.
표시기에는 고밀도 보류 주문 영역을 진입 구역으로 찾고 가격 조치 규칙을 통해 필터링하는 특수 계산이 있습니다. 새로운 Entry Zone 생성 후 "Entry" 태그가 있는 녹색 라인으로 확인을 기다립니다. 이 확인 후 영역 분할 측면(위에서 또는 아래로) 표시기를 기반으로 주문 유형을 결정합니다. 가격이 진입 가격으로 돌아오면 주문은 시장 거래로 간주되며 거래 수명을 명확하게 표시하기 위해 SL 직사각형이 그려집니다. 가격이 거래를 대신하여 움직이면 SL 직사각형의 색상이 녹색이 되고 그 반대의 경우 빨간색이 됩니다.
이익 포인트가 SL 포인트와 같거나 클 때 거래는 수익성 있는 주문이 될 것입니다. 즉, 지표는 RR이 최소 1:1일 때

METATRADER 5에 대한 경고 위아래
이 표시기는 가격이 UP과 DOWN 라인 사이의 영역을 벗어날 때 경고를 생성합니다.
다음과 같은 다양한 유형의 경고를 생성할 수 있습니다.
> 사운드
> 메시지 상자
> 전문가 상자의 메시지
> 메일(이전 구성)
> PUSH 알림(이전 구성)
선은 선 속성이 아니라 표시기 속성에서 구성해야 합니다. 선 속성에서 구성하면 피노나치가 영향을 받을 수 있기 때문입니다.
설정 중 색상, 선 스타일 및 너비를 변경할 수 있습니다. 선은 선 속성이 아니라 표시기 속성에서 구성해야 합니다. 선 속성에서 구성하면 피노나치가 영향을 받을 수 있기 때문입니다.
설정 중 색상, 선 스타일 및 너비를 변경할 수 있습니다. 선은 선 속성이 아니라 표시기 속성에서 구성해야 합니다. 선 속성에서 구성하면 피노나치가 영향을 받을 수 있기 때문입니다.
설정 중 색상, 선 스타일 및 너비를 변경할 수 있습니다.
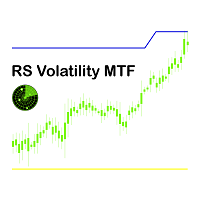
레이더 신호 변동성 다중 시간 프레임 표시기메타 트레이더 4 레이더 신호 변동성 다중 시간 프레임 표시기 매우 신뢰할 수 있는 추세 지표로 개발되었습니다. 레이더 신호 변동성 다중 시간 프레임 모든 외환 통화 쌍에 적합하며 모든 종류의 시간대 차트와 일치할 수 있습니다. 레이더 신호 변동성 다중 시간 프레임 표시기 이동 평균 시스템과 가격의 교차를 기반으로 추세 신호를 생성합니다. 평균 실제 범위를 고려하면, 이제 정확한 진입점이 정의됩니다. 노란색 선은 이 가능한 진입점을 나타냅니다. 가격이 노란색 선을 넘으면 거래를 시작할 수 있습니다. 파란색 선은 가능성을 나타냅니다. 이익을 취하십시오. 가격이 파란색 선을 넘으면 거래를 종료할 수 있습니다. 두 개의 녹색 선은 종가가 녹색 선을 점으로 깨면 추세가 변경되는 영역을 보여줍니다. 점이 있는 이 녹색 선은 가능한 SL, 가능한 손익분기점 또는 가능한 후행 정지점으로 사용할 수 있습니다. 점이 없는 녹색선은 가격이 이 녹색에
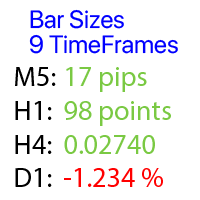
선택한 막대 시프트로 각 시간대의 가격 변화를 계산합니다
내#1 조수 :36 개 이상의 기능 포함 / 질문이 있으면 저에게 연락하십시오 프로그램 파일을 " Indicators " 디렉토리에 배치해야합니다
초기 설정에서 현재 막대를 기준으로 계산 된 막대의 시프트를 설정할 수 있습니다: 1=마지막 닫힌 막대의 값, 0=현재(열린)막대의 부동 값, 2=2 바 뒤로,등등. 가격 값의 유형은 상단 행의 파란색 스위치를 사용하여 선택할 수 있습니다: 핍스; 시장 포인트; 백분율 값(%); 가격 가치; 가격을 계산하는 방법은 하단 행의 왼쪽 버튼을 사용하여 선택할 수 있습니다: " Body ":(오픈 클로즈)가격; " Shadow ":(높음-낮음)가격; 이 유틸리티는 차트의 별도 창에 표시됩니다: <M> 버튼을 사용하여 창을 임의의 장소로 이동할 수 있습니다; 인터페이스는 "^" 버튼을 사용하여 최소화 할 수 있습니다; " Dark "버튼을 사용하여 밝은/어두운 테마 사이를 전환 할

with JR Trend you will able to enter and exit every trade with just a signals appear no need for any strategy just flow the indicator it work on all pairs and all Timeframe i usually take a look on higher timeframe and return to the lowest timeframe and make an order with indicator signals you can see the amazing result so you can depend only on it intraday or swing as you wish

Please read the comment section for more introduction about indicator. ( i cant put all lines in here their is limit ) Entry conditions ---------------- Scalping - Long = Green over Red, Short = Red over Green Active - Long = Green over Red & Yellow lines Short = Red over Green & Yellow lines Moderate - Long = Green over Red, Yellow, & 50 lines

Powerful Trading Tool for Your Desired Results This tool can help you achieve the trading results you want. It's a 2-in-1 solution, suitable for both Binary Options and Forex trading. Key Features: Versatility: It serves as a versatile tool for trading both Binary Options and Forex markets. Consistent Performance: The indicator demonstrates excellent performance on both Binary Options and Forex markets. Continuous Improvement: The tool will continue to be enhanced to meet evolving trading

TrendScanner XTra scans market trends from Multi Symbols and Multi Timeframes with extra additional Entry Point Signals arrow on the current chart. Features:
-Entry Point SIgnals : This is additional feature in the indicator. No repaint arrows. The Trading system in the single indicator. MTF Trend informations and Entry Signals. In order to make it easier for trader to get trading moments from a single chart and deciding entry time. -Changeable Panel Display : Change the value of Max.Symbo

As you know, the main invariable indicator of all traders is the moving average; it is used in some way in most strategies. It is also obvious that this indicator is capable of showing good entries in every local area. For which it usually needs to be optimized or just visually adjusted. This development is intended for automatic optimization of the indicator. Once placed on the chart, the indicator will automatically re-optimize itself with the specified period ( PeriodReOptimization ) and dis
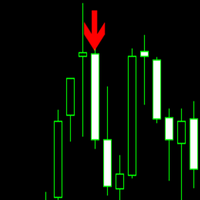
Trade trends with the Super Scalper Use on all time frames and assets it is designed for scalping trends. Works good on small time frames for day trading. The arrows are easy to follow. This is a simple no repaint/no recalculate arrow indicator to follow trends with. Use in conjunction with your own system or use moving averages. Always use stops just below or above the last swing point or your own money management system The indicator comes with push notifications, sound alerts and email

Excellent tool: added features - If you don't know exactly how to place the stop loss. This tool is right for you. After opening the position, 4 levels of stop glosses are drawn and you determine which form of risk suits you. You will significantly increase the chance that the market will not kick you out unnecessarily and then you will reach your tatget without you. If you need more information than a few numbers in the iExposure index, this indicator is for you.
Better iExposure indicator

The Salinui trend indicator works using a special algorithm. It finds the current trend based on many factors. Indicator entry points should be used as potential market reversal points. Simple and convenient indicator. The user can easily see the trends. The default indicator settings are quite effective most of the time. Thus, all entry points will be optimal points at which movement changes. You can customize the indicator based on your needs.
You can use this indicator alone or in combinat

The King of Forex Trend Cloud Indicator is a trend following indicator based on moving averages. The Indicator is meant to Capture both the beginning and the end of a trend. This indicator can be used to predict both short and long terms market trends. The king of Forex Trend Cloud if paired together with the King of Forex Trend Indicator can give a broad picture in market analysis and forecasts. I have attached images for both the The king of Forex Trend Cloud on its own and The king of Fore
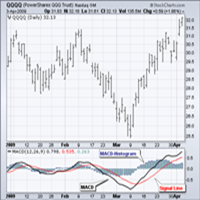
Standard MACD is the 12-day Exponential Moving Average (EMA) less the 26-day EMA. Closing prices are used to form the MACD's moving averages. A 9-day EMA of MACD is plotted along side to act as a signal line to identify turns in the indicator. The MACD-Histogram represents the difference between MACD and its 9-day EMA, the signal line. The histogram is positive when MACD is above its 9-day EMA and negative when MACD is below its 9-day EMA. Peak-Trough Divergence The MACD-Histogram anticipate

Catch major price movements, early in the trend. Alerts you to enter at the likely beginning of a trend, and if it's incorrect, quickly alerts you to exit to limit any loss. Designed to capture large, profitable price movements, with early entrance to maximize your returns. As shown in screenshots, typical behavior is several quick entrance/exists with small loss , and then capture of a large trend with high profits . The Instantaneous Trend indicator is a lag-reduced method to detect pri

The Extremum Average signal indicator works on all timeframes and any markets. Analyzes the smoothed data of extremums and gives signals to sell or buy.
The indicator has only two settings: Number of Bars - the number of last bars to search for an extremum Period Average - Period (number of last bars) for data smoothing For each timeframe and market, you need to select its own values. Additionally, in the indicator settings, you can set your own style of signal display: Size Arrow Code Arrow

The QRSI indicator is one of the most important and well-known indicators used by traders around the world. All signals are generated at the opening of the bar. Any closing price or zero bar prices are replaced with the corresponding price of the previous bar in order to avoid false results. This indicator is suitable for those who are interested in the classic calculation method but with improved functionality. There is a version for both MT4 and MT5.
By its nature, the QRSI indicator is

The Goodfellas indicator analyzes the price behavior and if there is a temporary weakness in the trend, you can notice it from the indicator readings, as in the case of a pronounced trend change. It is not difficult to enter the market, but it is much more difficult to stay in it. With the Goodfellas indicator it will be much easier to stay in trend! This indicator allows you to analyze historical data and, based on them, display instructions for further actions on the trader's screen.
Every

The Dictator indicator is based on the process of detecting the rate of change in price growth and allows you to find points of entry and exit from the market. a fundamental technical indicator that allows you to assess the current market situation in order to enter the market of the selected currency pair in a trend and with minimal risk. It was created on the basis of the original indicators of the search for extremes, the indicator is well suited for detecting a reversal or a large sharp jer

Artificial intelligence is a trend of the times and its power in decoding the market has been demonstrated in this indicator. Using a neural network to train the indicator to recognize trends and remove noise areas caused by price fluctuations, this indicator has obtained a reasonable smoothness for analyzing price trends. This indicator is none repaint. Suitable for day traders or longer traders *Non-Repainting (not redrawn) *For Metatrader4 Only *Great For Swing Trading *Histogram Up is Long,

Market Profile
Shows where the price has spent more time, highlighting important levels that can be used in trading.
It is a powerful tool which is designed to take the fundamental components which comprise every market; price/volume/time, and visually display their relationship in real-time as the market develops for a pre-determined time period. Very powerful tool!

The resistance and support lines are the position where the price will have a change, be it a breakout to follow the trend or reverse. The price rule will go from support to resistance and Long's resistance can be Short's support and the opposite is true. Accurately identifying support and resistance lines is the key to being able to trade well and profitably. This indicator is based on the Fractals indicator, the indicator will be redrawn by 2 candles. *Great For Swing Trading *Blue is Support

VWAP Bands Metatrader 4 Forex Indicator
The VWAP Bands Metatrader 4 Forex indicator is a quite similar to the Bollinger bands, but it deploys volume weighted average as the core value of the bands. There is an option of using the tick volume or real volume for calculation when using the VWAP Bands Metatrader 5 custom forex indicator, especially when the forex broker displays symbol alongside real volume. Similarly, you can decide to have deviations calculated with the sample correction or not
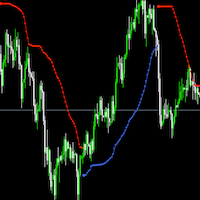
Bbandtrend 一款趋势指标,可以用来判断外汇、黄金等商品的趋势,用于辅助交易,提高交易的胜率。每个人都可以调整参数,适应不同的货币。 指标多空颜色可以自定义。 extern int Length=60; // Bollinger Bands Period extern int Deviation=1; // Deviation was 2 extern double MoneyRisk=1.00; // Offset Factor extern int Signal=1; // Display signals mode: 1-Signals & Stops; 0-only Stops; 2-only Signals; extern int Line=1; // Display line mode: 0-no,1-yes extern int Nbars=1000;
MetaTrader 플랫폼 어플리케이션 스토어에서 MetaTrader 마켓에서 트레이딩 로봇을 구매하는 방법에 대해 알아 보십시오.
MQL5.community 결제 시스템은 페이팔, 은행 카드 및 인기 결제 시스템을 통한 거래를 지원합니다. 더 나은 고객 경험을 위해 구입하시기 전에 거래 로봇을 테스트하시는 것을 권장합니다.
트레이딩 기회를 놓치고 있어요:
- 무료 트레이딩 앱
- 복사용 8,000 이상의 시그널
- 금융 시장 개척을 위한 경제 뉴스
등록
로그인
계정이 없으시면, 가입하십시오
MQL5.com 웹사이트에 로그인을 하기 위해 쿠키를 허용하십시오.
브라우저에서 필요한 설정을 활성화하시지 않으면, 로그인할 수 없습니다.