手動チャートおよび取引ツールキット(第II部)チャートグラフィック描画ツール

はじめに
前の記事の目的は、キーボードショートカットを使用してチャートに直線をすばやく描画できる便利なツールキットを作成することでした。最初の記事には、既製のソリューションがどのように機能するかを示すビデオが含まれています。
現在の実装にはGUIはありません(将来的に計画されています)。プログラムは、キーボードショートカットに基づいて線を引くだけです。現在のチャートの「レベル」(Zインデックス)の変更、時間枠の切り替え、直線描画モード(半直線/線分)の切り替えなどのアクションへのアクセスを高速化します。
マウスの位置によって、オブジェクトを描画する場所が決まります。ポインタが価格を上回っている場合は、ローソク足の高値が基本点として選択されます。ポインタが価格を下回っている場合、安値が使用されます。
現在のライブラリバージョンでは、次のオブジェクトを描画できます。
- 単純な(「無限」)直線 - 縦および横の線。
- 通常のトレンドの線(マウスに最も近い2つの極値点による)。線を線分または半直線として描画するように設定できます。線が線分の場合、特別なモードでは、その終点を将来の点に設定できます。この場合、線のサイズは、極値間の距離に特定の係数を掛けたものに等しくなります。この係数は、EAパラメータで指定できます。
- 特定の長さの水平レベル(無限ではありません)。ツールキットは、短い線と「延長された」線を描画できます。この線に対して、短い線に対する比率を指定します。
- レベルラベル付きの縦線。
- フィボナッチファン。レベルパラメータは設定可能ですが、私はわずかに変更されたバージョンを使用します。これは、Vadimchaと呼ばれる男性によって「Onyx」に提示されたことがあります。このファンはVFanと呼ばれたので、コードでは引き続きこの名前を使用します。
- 3つのオブジェクトで構成されるAndrewsのピッチフォークセット。
プロジェクトの構造は非常に単純です。ライブラリには、「GlobalVariables.mqh」、「Graphics.mqh」、「Mouse.mqh」、「Shortcuts.mqh」、「Utilites.mqh」 の5つの関連ファイルがあります。すべてのファイルは、標準のIncludeディレクトリの単一のShortcutsフォルダにあります。
メインファイルはShortcuts.mqhで、他のすべてのファイルが接続されています。このファイルにはCShortcutsクラスのインスタンスが作成され、ライブラリをメインのエキスパートアドバイザーに簡単に接続できるようになります。
前回の記事では、ヘルパーファイルUtilites.mqhに焦点を当てました。この記事では、主に描画ロジックを含むGraphics.mqhファイルを扱います。
グローバル設定ファイル
ライブラリの2番目のバージョンは、影響を受ける可能性のあるオブジェクトが多いため、大幅に拡張された構成オプションを提供します。現在のバージョンの完全なコードは次のとおりです。
//+------------------------------------------------------------------+
//|                                              GlobalVariables.mqh |
//|                        Copyright 2020, MetaQuotes Software Corp. |
//|                            https://www.mql5.com/ja/articles/7908 |
//+------------------------------------------------------------------+
#property copyright "Copyright 2020, MetaQuotes Software Corp."
#property link      "https://www.mql5.com/ja/articles/7908"
//+------------------------------------------------------------------+
//| File describing parameters available to the user                 |
//+------------------------------------------------------------------+
#define VERSION 2.0 // Not #property but a constant. A bit more convenient.
//+------------------------------------------------------------------+
//| Key settings                                                     |
//+------------------------------------------------------------------+
input string   Keys="=== Key settings ===";
input string   Up_Key="U";                          // Switch timeframe up
input string   Down_Key="D";                        // Switch timeframe down
input string   Trend_Line_Key="T";                  // Trend line
input string   Switch_Trend_Ray_Key="R";            // Indication of a trend line ray
input string   Z_Index_Key="Z";                     // Indication of the chart on top
input string   Vertical_With_Short_Levels_Key="V";  // Vertical segment
input string   Short_Level_Key="S";                 // Short level
input string   Long_Level_Key="L";                  // Extended level
input string   Simple_Horizontal_Line_Key="H";      // Simple horizontal line
input string   Simple_Vertical_Line_Key="I";        // Simple vertical line
input string   VFun_Key="F";                        // Fibonacci fan
input string   Pitchfork_Key="P";                   // Andrews' pitchfork

//+------------------------------------------------------------------+
//| Color setting                                                    |
//+------------------------------------------------------------------+
input string   Colors="=== Color Settings ===";
input color    VFan_Color=clrLightGray;            // Color of the fan lines
                                                   //   (and an additional
                                                   //    one for special cases)
//---
input color    Pitchfork_Main_Color = clrBlue;     // Andrews' pitchfork color
input color    Pitchfork_Shiff_Color = clrRed;     // Schiff pitchfork color
input color    Pitchfork_Reverce_Color = clrYellow;// "Reverse" pitchfork color

//+------------------------------------------------------------------+
//| Size settings                                                    |
//+------------------------------------------------------------------+
input string   Dimensions="=== Size settings ===";
input int      Short_Level_Length=12;     // Short level length (bar)
input int      Short_Level_Width=1;       // Line width for the short level
input int      Long_Level_Width=2;        // Line width for the long level
input int      Vertical_With_Short_Levels_Width=1; // Vertical line width with levels
input int      Short_Level_7_8_Width=1;   // Level 7/8 line width
input int      Short_Level_14_8_Width=1;  // Level 14/8 line width
input int      Simple_Vertical_Width=1;   // Simple vertical line width
input int      Simple_Horizontal_Width=1; // Simple horizontal line width
input int      Trend_Line_Width=2;        // Trend line width

//+------------------------------------------------------------------+
//| Display styles                                                   |
//+------------------------------------------------------------------+
input string   Styles="=== Display styles ===";
input ENUM_LINE_STYLE      Vertical_With_Short_Levels_Style=STYLE_SOLID; // Vertical Line style
                                                                         // with levels
input ENUM_LINE_STYLE      Short_Level_Style=STYLE_SOLID;      // Short Level style
input ENUM_LINE_STYLE      Long_Level_Style=STYLE_SOLID;       // Long level style
input ENUM_LINE_STYLE      Short_Level_7_8_Style=STYLE_SOLID;  // Level 7/8 style
input ENUM_LINE_STYLE      Short_Level_14_8_Style=STYLE_DOT;   // Level 14/8 style
input ENUM_LINE_STYLE      Simple_Vertical_Style=STYLE_DOT;    // Simple Vertical style
input ENUM_LINE_STYLE      Simple_Horizontal_Style=STYLE_DOT;  // Simple Horizontal style
input ENUM_LINE_STYLE      VFun_Levels_Style=STYLE_SOLID;      // Fan Style
input ENUM_LINE_STYLE      Trend_Line_Style=STYLE_SOLID;       // Trend line style
//---
input ENUM_LINE_STYLE      Pitchfork_Main_Style = STYLE_SOLID;    // Andrews' Pitchfork style
input ENUM_LINE_STYLE      Pitchfork_Shiff_Style = STYLE_SOLID;   // Schiff Pitchfork style
input ENUM_LINE_STYLE      Pitchfork_Reverce_Style = STYLE_SOLID; // Reverse Pitchfork style
//+------------------------------------------------------------------+
//| Pitchfork extrema parameters                                     |
//+------------------------------------------------------------------+
input string               Pitchforks="=== Pitchfork Extrema Parameters ===";
//---
input int                  Pitchfork_First_Point_Left_Bars=6;   // Pitchfork - 1st point, bars on the left
input int                  Pitchfork_First_Point_Right_Bars=6;  // Pitchfork - 1st point, bars on the left
//---
input int                  Pitchfork_Second_Point_Left_Bars=6;  // Pitchfork - 2nd point, bars on the left
input int                  Pitchfork_Second_Point_Right_Bars=6; // Pitchfork - 2nd point, bars on the right
//---
input int                  Pitchfork_Third_Point_Left_Bars=6;   // Pitchfork - 3rd point, bars on the left
input int                  Pitchfork_Third_Point_Right_Bars=2;  // Pitchfork - 3rd point, bars on the right
//+------------------------------------------------------------------+
//| Other parameters                                                 |
//+------------------------------------------------------------------+
input string               Others="=== Other Parameters ===";
input double               Vertical_Short_Level_Coefficient=0.825;  // Coefficient of vertical levels
input double               Long_Level_Multiplicator=2;              // Multiplier for the long level
input int                  Trend_Length_Coefficient=4;              // Coefficient for the trend line length
input bool                 Is_Trend_Ray=false;                      // Trend line - ray
input bool                 Is_Change_Timeframe_On_Create = true;    // Hide objects on higher timeframes?
                                                                    //   (true - hide, false - show)
input bool                 Is_Select_On_Create=true;                // Select upon creation
input bool                 Is_Different_Colors=true;                // Change colors for times

// Number of bars on the left and on the right
// for trend line and fan extreme points
input int                  Fractal_Size_Left=1;                     // Size of the left fractal
input int                  Fractal_Size_Right=1;                    // Size of the right fractal

input bool                 Pitchfork_Show_Main = true;     // Display Andrews' pitchfork
input bool                 Pitchfork_Show_Shiff = true;    // Display Schiff pitchfork
input bool                 Pitchfork_Show_Reverce = true;  // Display "Reverse" pitchfork
input bool                 Print_Warning_Messages=true;    // Display error messages
input string               VFun_Levels="-1.5,-0.618,-0.236,"+
                                       "  0,0.236,0.382,"+
                                       "  0.618,0.786,0.886,0.942";  // Fan levels
input string               Array_Delimiter=",";            // Array elements separator
//---

//+------------------------------------------------------------------+
//| Name prefixes of drawn shapes (can be change only in code,       |
//| not visible in EA parameters)                                    |
//+------------------------------------------------------------------+
//string   Prefixes="=== Prefixes ===";
//string   Vertical_With_Short_Levels_Prefix="Vertical_";  // Prefix for vertical lines with levels
//string   Short_Level_Prefix="Short_Level_";              // Prefix for short levels
//string   Long_Level_Prefix="Long_Level_";                // Prefix for long levels
//string   Simple_Horizontal_Prefix="Simple_H_";           // Prefix for simple horizontal lines
//string   Simple_Vertical_Prefix="Simple_V_";             // Prefix for simple vertical lines
//string   VFan_Prefix="VFan_";                            // Prefix for fan
//string   Trend_Line_Prefix="Trend_";                     // Prefix for trend lines
//string   Pitchfork_Prefix="Pitchfork_";                  // Prefix for pitchfork
string   allPrefixes[] =      // Prefixes for object names
  {
   "Trend_",            // 0 - Prefix for trend lines
   "Simple_H_",         // 1 - Prefix for simple horizontal lines
   "Simple_V_",         // 2 - Prefix for simple vertical lines
   "VFan_",             // 3 - Prefix for fan
   "Pitchfork_",        // 4 - Prefix for pitchfork
   "Vertical_",         // 5 - Prefix for vertical lines with levels
   "Short_Level_",      // 6 - Prefix for short levels
   "Long_Level_"        // 7 - Prefix for long levels
  };

//+------------------------------------------------------------------+
//| Colors for objects of one timeframe (can be changed only in code,|
//| not visible in EA parameters)                                    |
//+------------------------------------------------------------------+
// string TimeframeColors="=== Standard Colors for Timeframes  ===";
color mn1_color=clrCrimson;
color w1_color=clrDarkOrange;
color d1_color=clrGoldenrod;
color h4_color=clrLimeGreen;
color h1_color=clrLime;
color m30_color=clrDeepSkyBlue;
color m15_color=clrBlue;
color m5_color=clrViolet;
color m1_color=clrDarkViolet;
color common_color=clrGray;

//--- Auxiliary constant for displaying error messages
#define DEBUG_MESSAGE_PREFIX "=== ",__FUNCTION__," === "

//--- Constants for describing the main timeframes when drawing
//--- For compatibility with version 4, timeframes that do not exist
//---    in the toolbar are excluded.
#define PERIOD_LOWER_M5 OBJ_PERIOD_M1|OBJ_PERIOD_M5
#define PERIOD_LOWER_M15 PERIOD_LOWER_M5|OBJ_PERIOD_M15
#define PERIOD_LOWER_M30 PERIOD_LOWER_M15|OBJ_PERIOD_M30
#define PERIOD_LOWER_H1 PERIOD_LOWER_M30|OBJ_PERIOD_H1
#define PERIOD_LOWER_H4 PERIOD_LOWER_H1|OBJ_PERIOD_H4
#define PERIOD_LOWER_D1 PERIOD_LOWER_H4|OBJ_PERIOD_D1
#define PERIOD_LOWER_W1 PERIOD_LOWER_D1|OBJ_PERIOD_W1
//+------------------------------------------------------------------+
以前のバージョンと比較した追加はすべて黄色で強調表示されています。これらの新機能により、直線だけでなく、画面に表示される他のオブジェクトも構成できます。
オブジェクトプレフィックスの名前を配列に入れて、後で使用しやすくします。たとえば、複雑なオブジェクト(例:vレベル付きの縦線)を削除する機能を追加する予定です。このような場合、配列の方が便利です。
設定を検討したので、グラフィックスに進みます。
「プリミティブ」の描画: 縦線と横線
最初に作成するオブジェクトは、レベルとタイムライン(無限の縦線と横線)です。実際、ライブラリはこれらの行から始まります。
コードは次のとおりです。
//+------------------------------------------------------------------+
//| Draws simple straight lines (vertical and horizontal) in the     |
//| position specified by mouse or parameters                        |
//| Parameters:                                                      |
//|   _object_type - object type. Can be OBJ_VLINE or OBJ_HLINE      |
//|   _time - time.  If not specified, mouse time is used            |
//|   _price - price. If not specified, price under index is used.   |
//+------------------------------------------------------------------+
void              CGraphics::DrawSimple(
   ENUM_OBJECT _object_type, // Object type
   datetime    _time=-1,     // Time
   double      _price=-1     // Price
)
  {
//---
   string Current_Object_Name;   // The name of the future object
   color Current_Object_Color=   // Color (depends on the "standard" color of the timeframe)
      CUtilites::GetTimeFrameColor(CUtilites::GetAllLowerTimeframes());
   datetime Current_Object_Time; // Starting point time
   double Current_Object_Price;  // Starting point price
   ENUM_LINE_STYLE Current_Object_Style=STYLE_DOT; // Line style
   int Current_Object_Width=1;   // Line width
   int window=0;                 // Subwindow number

//--- Set up line parameters depending on the type
   if(_object_type==OBJ_VLINE)   // For vertical lines
     {
      Current_Object_Name=       // Generate the name
         CUtilites::GetCurrentObjectName(
            Simple_Vertical_Prefix,
            _object_type
         );
      // style - according to global parameters
      Current_Object_Style=Simple_Vertical_Style;
      // width - according to global parameters
      Current_Object_Width=Simple_Vertical_Width;
     }
   else
      if(_object_type==OBJ_HLINE)// For horizontal lines
        {
         Current_Object_Name=    // Generate the name
            CUtilites::GetCurrentObjectName(
               Simple_Horizontal_Prefix,
               _object_type
            );
         // style - according to global parameters
         Current_Object_Style=Simple_Horizontal_Style;
         // width - according to global parameters
         Current_Object_Width=Simple_Horizontal_Width;
        }
      else  // This function only draws horizontal and vertical lines.
        {
         // If something else is passed in parameters...
         if(Print_Warning_Messages)
           {
            // ...report an error...
            Print(DEBUG_MESSAGE_PREFIX,"Error, wrong object type");
           }
         // ...and exit.
         return;
        }

//--- If coordinates are not specified in the parameters, use the coordinates of the mouse
   Current_Object_Price = _price==-1 ? CMouse::Price() : _price;
   Current_Object_Time = _time==-1 ? CMouse::Time() : _time;

//--- Create the object
   ObjectCreate(
      0,
      Current_Object_Name,
      _object_type,
      0,
      Current_Object_Time,
      Current_Object_Price
   );

//--- Set display parameters for the created object
   CurrentObjectDecorate(
      Current_Object_Name,
      Current_Object_Color,
      Current_Object_Width,
      Current_Object_Style
   );

//--- Redraw the chart and complete
   ChartRedraw(0);
  }
操作はとても簡単です。名前を生成し、「GlobalVariables.mqh」ファイルに記述されているinput変数から設定を取得し、オブジェクトの開始点の座標を取得します(関数パラメータから、または単にマウスの座標を使用)、オブジェクトの準備ができました。
これだけです。
次に、この関数をファイルヘッダに追加します。
//+------------------------------------------------------------------+
//|                                                     Graphics.mqh |
//|                        Copyright 2020, MetaQuotes Software Corp. |
//|                            https://www.mql5.com/es/articles/7468 |
//+------------------------------------------------------------------+

// ...

//+------------------------------------------------------------------+
//| Class for plotting graphic objects                               |
//+------------------------------------------------------------------+
class CGraphics
  {

   // ...

public:

   // ...

   //--- Draws simple straight lines (vertical and horizontal)
   void              CGraphics::DrawSimple(
      ENUM_OBJECT _object_type, // Object type
      datetime    _time=-1,     // Time
      double      _price=-1     // Price
   )

   // ...
  }
;
//+------------------------------------------------------------------+
また、対応するキー押下の処理を追加します。
//+------------------------------------------------------------------+
//|                                                    Shortcuts.mqh |
//+------------------------------------------------------------------+

// ...

//+------------------------------------------------------------------+
//| Event handling function                                          |
//+------------------------------------------------------------------+
void CShortcuts::OnChartEvent(
   const int id,
   const long &lparam,
   const double &dparam,
   const string &sparam
)
  {
//---
   int window = 0;
//---
   switch(id)
     {

      // ...

      //--- Handle keystrokes
      case CHARTEVENT_KEYDOWN:

         // ...

         //--- Draw a simple vertical line
         if(CUtilites::GetCurrentOperationChar(Simple_Vertical_Line_Key) == lparam)
           {
            m_graphics.DrawSimple(OBJ_VLINE);
           }
         //--- Draw a simple horizontal line
         if(CUtilites::GetCurrentOperationChar(Simple_Horizontal_Line_Key) == lparam)
           {
            m_graphics.DrawSimple(OBJ_HLINE);
           }

         // ...

         break;
         //---

     }
  }
将来的には、画面スペースを節約して主要なアイデアに集中するために、関数の説明を追加するときにヘッダエントリを書き込まず、新しく追加されたコマンドに対して適切な行(黄色で強調表示)を表示します 。
すべての追加とコンパイルの結果は非常に単純です。以下は、現在のウィンドウの任意の場所にグラフィックプリミティブを描画する2つのコマンドです。

これらの線のデフォルトのキーショートカットは、I(i)およびH(h)です。
現在の時間枠によって、作成されるオブジェクトの色が異なることを忘れないでください。また、短時間のオブジェクトは、より長い時間枠には表示されません(デフォルト設定の場合)。


MQL4との互換性のために、デフォルトで表示される標準ツールバーの時間枠のみを使用します。これらの時間枠は、UキーとDキーを使用してスクロールすると選択できます(これらのキーを押すと、チャートの期間が1時間枠ずつ上下に変更されます。CUtilites::ChangeTimeframes関数を参照してください)。
VFun、またはフィボナッチファン
次の形はフィボナッチファンです。これはよく使います。しかし、毎回別のターミナルを使用しなければならないたびにすべての半直線を覚えておくのは非常に不便でした。そのため、このツールを素晴らしいEAに追加することにしました。
アイデアをさらに発展させ、ライブラリを使用して描画された任意のオブジェクト(ファンチャネルまたは水平フィボレベル)のフィボナッチレベルを設定できるユニバーサル関数を実装することにしました。これがその関数です。
//+------------------------------------------------------------------+
//| Sets level values and form in any Fibonacci object               |
//|    Uses colors and styles from the class fields                  |
//| Parameters:                                                      |
//|    _object_name - the name of the Fibonacci object               |
//|    _levels_values[] - array of level values                      |
//+------------------------------------------------------------------+
void CGraphics::SetFiboLevels(
   string _object_name,                      // Object name
   const double &_levels_values[]            // Array of values
)
  {
   int i,                                      // Current level counter
       levels_count=ArraySize(_levels_values); // Total number of levels

//--- Check if the number of values in the array exceeds the allowed range
   if(levels_count>32 || levels_count==0)
     {
      Print(DEBUG_MESSAGE_PREFIX,": Levels cannot be set! Data array is incorrectly. ");
      return;
     }

//--- Proceed with the implementation

//--- Set the number of levels for the current object
   ObjectSetInteger(0,_object_name,OBJPROP_LEVELS,levels_count);
//--- Set value, color and style for each level.
   for(i=0; i<levels_count; i++)
     {
      ObjectSetDouble(0,_object_name,OBJPROP_LEVELVALUE,i,_levels_values[i]);
      ObjectSetInteger(0,_object_name,OBJPROP_LEVELCOLOR,i,m_Fibo_Default_Color);
      ObjectSetInteger(0,_object_name,OBJPROP_LEVELSTYLE,i,m_Fibo_Default_Style);
     }
//--- Redraw the chart before finishing
   ChartRedraw(0);
  }
渡される関数パラメータには、レベルが設定されているオブジェクトの名前とすべてのレベル値の配列が含まれます。
まず、関数は渡されたレベルの数を確認します。配列が大きすぎる場合、エラーが発生したと見なし、何もしません。配列に要素がない場合も終了します。
すべてが正常で、配列内の要素の数が許容範囲を超えていない場合は、レベルの追加を開始します。オブジェクトの名前はパラメータで指定されるため、オブジェクトの対応するプロパティを配列要素の数に等しく設定し、適切なレベルを設定しながら配列全体を反復処理するだけです。
MQL5では、さまざまなパラメータをさまざまなレベルに設定することもできます。たとえば、さまざまな色を設定できます。また、さまざまなスタイル(実線、破線など)を使用できます。MQL4ではそのようなオプションは提供されません。それでも、ループにレベルの色とスタイルを定義する行を追加しました。これは、MQL5に普遍性を与える一方、コンパイルに影響しません。
デフォルトパラメータを記述する変数は、CGraphicsクラスのprivateメンバーとして記述され、EAパラメータの値を使用してクラスコンストラクタで初期化されます。
//+------------------------------------------------------------------+
//|                                                     Graphics.mqh |
//+------------------------------------------------------------------+
//+------------------------------------------------------------------+
//| Class for plotting graphic objects                               |
//+------------------------------------------------------------------+
class CGraphics
  {
   //--- Fields
private:
   // ...
   color             m_Fibo_Default_Color;
   ENUM_LINE_STYLE   m_Fibo_Default_Style;
   // ...
//+------------------------------------------------------------------+
//| Default constructor                                              |
//+------------------------------------------------------------------+
CGraphics::CGraphics(void)
  {
   //...
   m_Fibo_Default_Color = Fibo_Default_Color;
   m_Fibo_Default_Style = VFun_Levels_Style;
  }
   // ...
互換性が重要でない人のために、この関数のオーバーライドを追加しました。関数パラメータで渡された配列を使用して、各レベルのパラメータを設定できます。コードからすべてが明らかだと思います。さらに説明が必要な場合は、コメントをお願いします。関数のオーバーライドは、添付のzipファイルで有効になっています。
以下は、フィボナッチオブジェクトのレベルの説明を設定する別の関数です。
//+------------------------------------------------------------------+
//| Sets descriptions of levels in any Fibonacci object              |
//|    _object_name - the name of the Fibonacci object               |
//|    _levels_descriptions[] - array of level descriptions          |
//+------------------------------------------------------------------+
void CGraphics::SetFiboDescriptions(
   string _object_name,                  // Object name
   const string &_levels_descriptions[]  // Array of descriptions
)
  {
   int i,                                                                  // Current level counter
       levels_count=(int)ObjectGetInteger(0,_object_name,OBJPROP_LEVELS),  // The real number of levels
       array_size=ArraySize(_levels_descriptions);                         // The number of received descriptions
//--- Loop  through all levels
   for(i=0; i<levels_count; i++)
     {
      if(array_size>0 && i<array_size) // Choose a description from the array
        {
         //--- and write it to the level
         ObjectSetString(0,_object_name,OBJPROP_LEVELTEXT,i,_levels_descriptions[i]);
        }
      else // If the descriptions are not enough,
        {
         ObjectSetString(0,_object_name,OBJPROP_LEVELTEXT,i,""); // leave the description empty
        }
     }
//--- Redraw the chart before finishing
   ChartRedraw(0);
  }
ここでは複雑なことは何もありません。唯一の条件は、この関数が呼び出されるまでに、オブジェクトレベルがすでに設定されている必要があるということです。そして、関数は単にこれらのレベルを反復処理して、対応する値を配列から各レベルの説明に割り当てます。配列内のデータが十分でない場合、一部のレベルは説明なしのままになります。
レベルの追加が簡単になったので、フィボナッチファンを追加する関数を書くことができます。
//+------------------------------------------------------------------+
//| Draws a Fibonacci fan from the nearest local extremum.           |
//+------------------------------------------------------------------+
void CGraphics::DrawVFan(void)
  {
//---
   double levels_values[];                 // Array of level values
   string levels_descriptions[] = {};      // Array of level descriptions
   int p1=0,                               // Bar number for the fan starting point
       p2=0;                               // Bar number for the fan ending point
   double price1=0,                        // First point price
          price2=0;                        // Second point price
   string fun_name =                       // Fan name
      CUtilites::GetCurrentObjectName(allPrefixes[3],OBJ_FIBOFAN),
      fun_0_name =
         CUtilites::GetCurrentObjectName(allPrefixes[3]+"0_",OBJ_TREND);

//--- Get data for the fan from the parameter string
   CUtilites::StringToDoubleArray(VFun_Levels,levels_values);

//--- Find the extreme points closest to the mouse
   if(CMouse::Below())     // If the mouse cursor is below the price
     {
      CUtilites::SetExtremumsBarsNumbers(false,p1,p2);
      price1=iLow(Symbol(),PERIOD_CURRENT,p1);
      price2=iLow(Symbol(),PERIOD_CURRENT,p2);
     }
   else
      if(CMouse::Above())  // If the mouse cursor is above the price
        {
         CUtilites::SetExtremumsBarsNumbers(true,p1,p2);
         price1=iHigh(Symbol(),PERIOD_CURRENT,p1);
         price2=iHigh(Symbol(),PERIOD_CURRENT,p2);
        }
//--- Create the fan object
   ObjectCreate(
      0,fun_name,OBJ_FIBOFAN,0,
      iTime(Symbol(),PERIOD_CURRENT,p1),
      price1,
      iTime(Symbol(),PERIOD_CURRENT,p2),
      price2
   );

//--- The zero ray of this object is denoted by a colored line (for compatibility with MT4)
   TrendCreate(
      0,
      fun_0_name,
      0,
      iTime(Symbol(),PERIOD_CURRENT,p1),
      price1,
      iTime(Symbol(),PERIOD_CURRENT,p2),
      price2,
      CUtilites::GetTimeFrameColor(CUtilites::GetAllLowerTimeframes()),
      0,1,false,true,true
   );

//--- Describe the fan levels
   SetFiboLevels(fun_name,levels_values);
   SetFiboDescriptions(fun_name, levels_descriptions);

//--- Set standard parameters (such as timeframes and selection after creation)
   CurrentObjectDecorate(fun_name,m_Fibo_Default_Color);
//--- Also make out the "substitute" ray
   CurrentObjectDecorate(
      fun_0_name,
      CUtilites::GetTimeFrameColor(
         CUtilites::GetAllLowerTimeframes()
      )
   );

//---
   ChartRedraw(0);
  }
ファンを形成する半直線の色が違うと便利だと思います。MQL4でこの機能を実装するには、前の記事のように、ファンの上に通常の直線を描く必要があります。
この場合、レベルのキャプションは必要ないので、空の配列を使用するだけです。
値の配列は、EAパラメータからユーティリティ関数を使用して作成されます。
CUtilites::StringToDoubleArray(VFun_Levels,levels_values);
文字列を数値の配列に変換するこのユーティリティについては、最初の記事で説明しました。
コマンドの説明のリストにファン描画コマンドを追加します。
//+------------------------------------------------------------------+
//|                                                   Shortcuts.mqhh |
//+------------------------------------------------------------------+

   //...
//--- Draw a Fibonacci fan (VFun)
         if(CUtilites::GetCurrentOperationChar(VFun_Key) == lparam)
           {
            m_graphics.DrawVFan();
           }
         break;
   //...
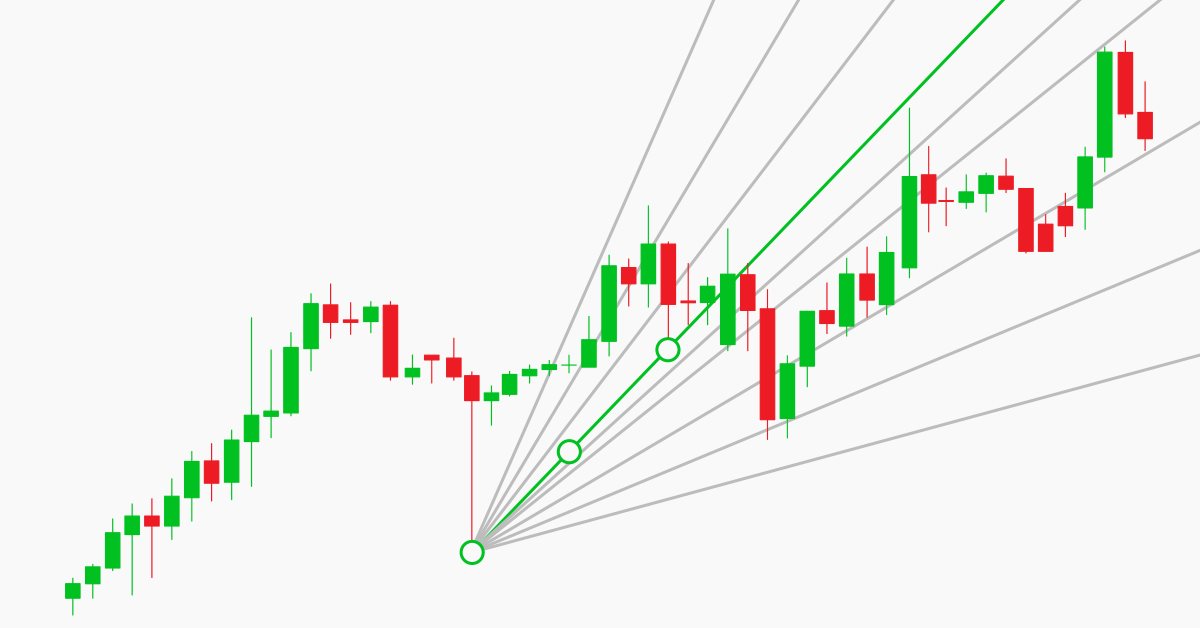
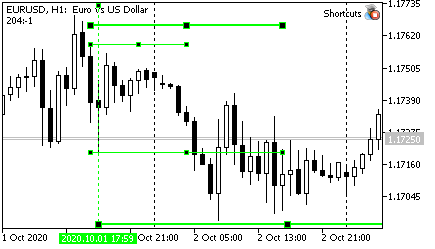
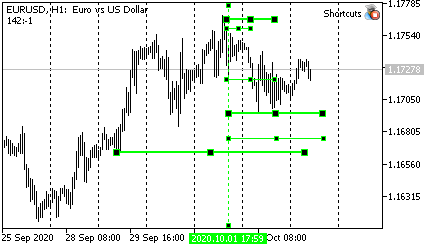
結果をコンパイルして確認します。ターミナルを開き、目的のチャートを開きます。
チャートの上部または下部から基本極値の左側にマウスを移動し、Fを押します。
")
ちなみに、この特定のファンの構成を見て、すぐに価格が下がると思いました。
そして、価格は最終的に下がりました。
")
アンドリュースピッチフォーク
私は3種類のピッチフォークを使用しています。
まず、必要な極値を選択し、「通常の」ピッチフォークを描きます。ピッチフォークの点は、ちょうど価格の極値と重なります。

アンドリュースが説明した2種類目のピッチフォークは、Schiffピッチフォークです。ここで、点1は、トレンド方向で距離1~2 の半分だけオフセットされています。したがって、中心線の傾きは小さくなります。動きがこれらのピッチフォークに収まる場合、おそらくフラットであるため、価格の動きは「修正」になります。

3種類目は「リバース」ピッチフォークです。点1は、逆トレンド方向に同じ1〜2の距離だけオフセットされます。このピッチフォークタイプは、速い動きに使用されます。通常、時間は短くなりますが、価格の距離が長くなります。

実際の分析では、私は3種類のピッチフォークを同時にチャートに表示することを好みます。そうすると、価格の動きは、将来の極値の可能性の要点とともに、はるかに明確になります。

このようなセットを描画するには、2つの関数が使用されます。1つ目は、任意のタイプのピッチフォークを1つ描画する関数です。
//+------------------------------------------------------------------+
//| Creates Andrews' pitchfork using specified coordinates            |
//| Parameters:                                                      |
//|    _name - the name of created pitchfork                         |
//|    _base - the structure containing coordinates of  basic points |
//|    _type - pitchfork type (SIMPLE,SHIFF,REVERCE)                        |
//+------------------------------------------------------------------+
void  CGraphics::MakePitchfork(
   string _name,           // The name of the created object
   PitchforkPoints &_base, // Structure describing pitchfork base points
   PitchforkType _type     // Pitchfork type (SIMPLE,SHIFF,REVERCE)
)
  {
//---
   double price_first;                 // The price of the first point (depends on the type)
   color pitchfork_color;              // Pitchfork color (depends on the type)
   int pitchfork_width;                // Line width (depends on the type)
   ENUM_LINE_STYLE pitchfork_style;    // Line style (depends on the type)
   double fibo_levels[] = {1};         // Add external levels (only for MQL5)
   string fibo_descriptions[] = {""};  // Level description (only for MQL5)

//--- Set type dependent parameters:
   if(_type == SHIFF)      // Schiff pitchfork
     {
      price_first = _base.shiffMainPointPrice;
      pitchfork_color = Pitchfork_Shiff_Color;
      pitchfork_width = Pitchfork_Shiff_Width;
      pitchfork_style = Pitchfork_Shiff_Style;
     }
   else
      if(_type == REVERCE) // "Reverse" pitchfork
        {
         price_first = _base.reverceMainPointPrice;
         pitchfork_color = Pitchfork_Reverce_Color;
         pitchfork_width = Pitchfork_Reverce_Width;
         pitchfork_style = Pitchfork_Reverce_Style;
        }
      else
        {
         // "classic" pitchfork
         price_first =_base.mainPointPrice;
         pitchfork_color = Pitchfork_Main_Color;
         pitchfork_width = Pitchfork_Main_Width;
         pitchfork_style = Pitchfork_Main_Style;
        }

//--- Draw
   ObjectCreate(0,_name,OBJ_PITCHFORK,0,
                _base.time1,price_first,
                _base.time2,_base.secondPointPrice,
                _base.time3,_base.thirdPointPrice
               );
//--- Set the parameters common for all graphical objects
   CurrentObjectDecorate(
      _name,
      pitchfork_color,
      pitchfork_width,
      pitchfork_style
   );
//--- If MQL5
#ifdef __MQL5__
//--- add external levels (early levels for Andrews' pitchfork)
   SetFiboLevels(_name,fibo_levels);
   SetFiboDescriptions(_name,fibo_descriptions);
#endif

//--- Update the chart picture
   ChartRedraw(0);
  }
2番目の関数は、作成されたピッチフォークの点1、2、3(ベース)の座標を計算し、3つのオブジェクトすべての描画を順番に開始します。ピッチフォークは、上記のCGraphics::MakePitchfork関数を使用して、この関数に基づいて描画されます。
//+------------------------------------------------------------------+
//| Draws set of Andrews' pitchforks on one base. The set includes    |
//|    three pitchfork types: regular, Schiff and reverse Schiff     |
//|    (aka "micmed channel")                                        |
//+------------------------------------------------------------------+
void CGraphics::DrawPitchforksSet(void)
  {
   bool up=true;                             // direction (mouse below or above the price)
   double dropped_price = CMouse::Price();   // "Starting point" price
   int dropped_bar = CMouse::Bar();          // Starting point bar number
   string name = "";                         // The name of the current object
   PitchforkPoints base;                     // Structure for the base coordinates
//---
   if(CMouse::Below())
     {
      up=false;
     }
   else
     {
      if(!CMouse::Above()) // If the mouse pointer is on the candlestick, do nothing
        {
         if(Print_Warning_Messages)
           {
            Print(DEBUG_MESSAGE_PREFIX,": Set a point above or below the bar extreme price");
           }
         return;
        }
     }
//--- Find extremum bar numbers
   int bar_first = CUtilites::GetNearestExtremumBarNumber(
                      dropped_bar,
                      true,
                      up,
                      Pitchfork_First_Point_Left_Bars,
                      Pitchfork_First_Point_Right_Bars
                   );
   int bar_second = CUtilites::GetNearestExtremumBarNumber(
                       bar_first-1,
                       true,
                       !up,
                       Pitchfork_Second_Point_Left_Bars,
                       Pitchfork_Second_Point_Right_Bars
                    );
   int bar_third = CUtilites::GetNearestExtremumBarNumber(
                      bar_second-1,
                      true,
                      up,
                      Pitchfork_Third_Point_Left_Bars,
                      Pitchfork_Third_Point_Right_Bars
                   );
//--- If not found, report an error
   if(bar_first<0||bar_second<0||bar_third<0)
     {
      if(Print_Warning_Messages)
        {
         Print(DEBUG_MESSAGE_PREFIX,": Could not find points that match all conditions.");
        }
      return;
     }

//--- Fill the structure for basic control points
   base.mainPointPrice = up ?                               // Price - first basic point
                         iHigh(Symbol(),PERIOD_CURRENT,bar_first)
                         : iLow(Symbol(),PERIOD_CURRENT,bar_first);
   base.secondPointPrice = up ?                             // Price - second basic point
                           iLow(Symbol(),PERIOD_CURRENT,bar_second)
                           : iHigh(Symbol(),PERIOD_CURRENT,bar_second);
   base.thirdPointPrice = up ?                              // Price - third basic point
                          iHigh(Symbol(),PERIOD_CURRENT,bar_third)
                          : iLow(Symbol(),PERIOD_CURRENT,bar_third);
   base.shiffMainPointPrice = base.mainPointPrice-          // Price - first point of Schiff pitchfork
                              (base.mainPointPrice-base.secondPointPrice)/2;
   base.reverceMainPointPrice = base.mainPointPrice+        // Price - first point of "reverse" pitchfork
                                (base.mainPointPrice-base.secondPointPrice)/2;
   base.time1 = iTime(Symbol(),PERIOD_CURRENT,bar_first);   // Time of the first point
   base.time2 = iTime(Symbol(),PERIOD_CURRENT,bar_second);  // Time of the second point
   base.time3 = iTime(Symbol(),PERIOD_CURRENT,bar_third);   // Time of the third point


//--- Draw "regular" pitchfork
   if(Pitchfork_Show_Main)
     {
      name =CUtilites::GetCurrentObjectName(allPrefixes[4]+"_main",OBJ_PITCHFORK);
      MakePitchfork(name,base,SIMPLE);
     }

//--- Draw Schiff pitchfork
   if(Pitchfork_Show_Shiff)
     {
      name =CUtilites::GetCurrentObjectName(allPrefixes[4]+"_shiff",OBJ_PITCHFORK);
      MakePitchfork(name,base,SHIFF);
     }

//--- Draw "reverse" pitchfork
   if(Pitchfork_Show_Reverce)
     {
      name =CUtilites::GetCurrentObjectName(allPrefixes[4]+"_reverce",OBJ_PITCHFORK);
      MakePitchfork(name,base,REVERCE);
     }
//---
//ChartRedraw(0); not needed here as it is called when drawing each object
  }
ピッチフォークの種類を説明するために、次の列挙を使用します。
//+------------------------------------------------------------------+
//| Possible Andrews' pitchfork types                                 |
//+------------------------------------------------------------------+
   enum PitchforkType
     {
      SIMPLE,
      SHIFF,
      REVERCE
     };
描画関数を呼び出すときに渡すパラメータを少なくするために、点の構造体(PitchforkPoints base;)を追加しました。
//+------------------------------------------------------------------+
//|  Structure describing a "base" for the Andrews' pitchfork         |
//+------------------------------------------------------------------+
   struct PitchforkPoints
     {
      double            mainPointPrice;        // Price - first base point
      double            shiffMainPointPrice;   // Price - second base point
      double            reverceMainPointPrice; // Price - third base point
      double            secondPointPrice;      // Price - first point of Schiff pitchfork
      double            thirdPointPrice;       // Price - first point of "reverse" pitchfork
      datetime          time1;                 // Time of the first point
      datetime          time2;                 // Time of the second point
      datetime          time3;                 // Time of the third point
     };
最後に、Shortcuts.mqhファイルのコントロールキーに反応の説明を追加します。
//+------------------------------------------------------------------+
//|                                                   Shortcuts.mqhh |
//+------------------------------------------------------------------+

   //...
//--- Draw Andrews' Pitchfork
         if(CUtilites::GetCurrentOperationChar(Pitchfork_Key) == lparam)
           {
            m_graphics.DrawPitchforksSet();
           }
         break;
   //...
コンパイルして確認します。
ピッチフォークセットをチャートに表示するには、Pキー(Pitchfork)を押します。
MetaTraderのトレンドライン描画機能
一般に、上記のオブジェクトは任意のグラフィックに使用できます。機能には、直線、Andresピッチフォーク、フィボナッチファン、水平および垂直レベルがあります。
同様に、マウスの右または左に極値を見つけることで、チャネル、水平フィボナッチレベルなどを描画できます。これらの形状を頻繁に使用する場合は、必要な機能を簡単に実装できます。
私にとって、このライブラリの最も難しい部分は、右に終点があり、将来の2番目の点を持つ直線に関するものでした。
このような線は、価格と時間の両方で重要なレベルをマークするのに非常に便利です。原則として、価格はこれらのレベルに気づき、少なくとも近くのどこかに極値を形成します。 非常に頻繁に価格が逆転します。
しかし、MetaTraderの線画機能は価格と時間を使用していることが判明しました。
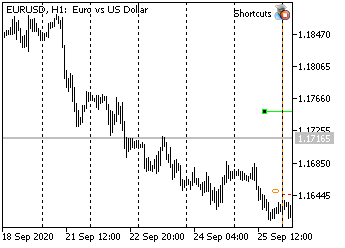
最初の問題は、金曜日に線が引かれ、その右端が月曜日にあるときに発生します。

MetaTraderは金曜日には日曜日があるはずだと考えますが、月曜日にその日は取引できなかったため2日を破棄する必要があることを理解します。このため、時間座標で描かれた線は短くなります。これは上の図にはっきりと見られます。
チャート上の特定の数のバーを測定する必要がある場合、この動作は不便です。
解決策は非常に簡単です。日付はカレンダーではなくポイントで計算できます。マウスの座標はチャート上の点を示します。 ローソク足間の距離はいつでも計算でき(たとえば、最初の部分の「隣接するバー間の距離(ピクセル単位)」のセクションで説明されているように)、カウントするだけで済みます。 標準のChartXYToTimePrice関数を使用して、必要な数のローソク足を修正し、画面座標を時間と価格に変換します。しかし、そのような直線は、「日曜日の崩壊」を避けるために、金曜日ではなく月曜日に引く必要があります。
良い方法に思えますが、注意点が1つあります。MetaTraderが線を引くことができるスペースのサイズが制限されているということです。プログラムで許可されているスペースよりも長い線を描画しようとすると(たとえば、左の図のように境界線に非常に近い)、予期しない効果が発生する可能性があります。
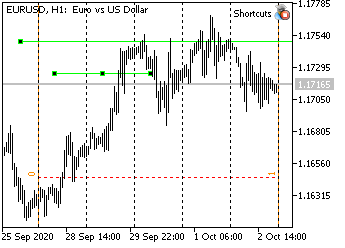
正しい図で同じ線が自動的に描画されていますが、チャートが右にシフトされて右端が表示されています。以下は、この縮尺であるはずの通常の線です。上の線のプロパティから判断すると、その右の終点はほぼ6か月進んでいます。
時々、傾斜した線で、線がどのように反転するかを見ました。MetaTraderは点の座標を正しい日付に変換できず、単に0に設定しました(したがって、日付は1970年1月1日でした)。線が日付で描かれている場合、この効果は発生しません。
結論的に、まだ定義されていない未来の日付を計算し、直線を簡単に描くことができる関数が必要です。
それでは、そのような関数を作成しましょう。
将来の日付を取得するための関数
通常、現在または過去に、何か(たとえば、ある種の極値)を測定したい点があります。さらに、通常、バー単位のシフト距離はわかっているか、簡単に計算できます。したがって、この関数の最も一般的なタスクは、バーのシフトに基づいて、あるポイントを基準にした時間を計算することです。ただし、私はスケールによってはレベルの増減の効果も気に入っています。そのため、関数で時間をバーではなくポイントで計算したい場合があります。
ポイントの数とバーの数はどちらも整数であるため、関数は正確に何をすべきかを理解するために何らかの機能を必要とします。この機能から始めましょう。
//+------------------------------------------------------------------+
//|                                              GlobalVariables.mqh |
//+------------------------------------------------------------------+

//...
//+------------------------------------------------------------------+
//| The enumeration describes possible options for calculating the   |
//|   time of the next bar                                           |
//|      COUNT_IN_BARS - calculate date by the number of bars        |
//|      COUNT_IN_PIXELS - calculate date by the number of pixels    |
//+------------------------------------------------------------------+
enum ENUM_FUTURE_COUNT {
   COUNT_IN_BARS,    // By bars
   COUNT_IN_PIXELS   // By pixel
};
//...
列挙とグローバル変数のすべての説明は、 GlobalVariables.mqhファイルにあります。将来の機能の間隔を選択するための可能なオプションの列挙もこのファイルに追加する必要があります。
関数自体は何も描画せず、マウスとは何の関係もありません。よって、それはユーティリティでなければなりません。
//+------------------------------------------------------------------+
//|                                                     Utilites.mqh |
//+------------------------------------------------------------------+

//...
class CUtilites
  {
public:
//...
   //--- Calculates a date in the future relative to the start date with the _length interval, specified in pixels or bars
   static datetime          GetTimeInFuture(
      const datetime _start_time,                         // Reference time based on which the future bar is calculated
      const int _length,                                  // Interval length (in bars or pixels)
      const ENUM_FUTURE_COUNT _count_type=COUNT_IN_BARS   // Interval type (pixels or bars).
   );

//...

//+------------------------------------------------------------------+
//| The function tries to calculate date in the future using the     |
//|   screen x and y coordinates                                     |
//| If calculation is unsuccessful (time exceeds limits), calculates |
//|   time with an error: as a sum of dates excluding Sundays.       |
//| Parameters:                                                      |
//|   _current_time,              Source time,                       |
//|   _length,                    Interval length                    |
//|                                 (in bars or in pixels)           |
//|   _count_type=COUNT_IN_BARS   How interval length is measured.   |
//|      COUNT_IN_BARS - the interval is set in bars;                |
//|      COUNT_IN_PIXELS - the interval is set in pixels.            |
//| Returns:                                                         |
//|   Time in the future distant from the _current_time              |
//|      by an interval in pixels or bars (_length)                  |
//+------------------------------------------------------------------+
datetime CUtilites::GetTimeInFuture(
   const datetime _start_time,                         // Reference time based on which the future bar is calculated
   const int _length,                                  // Interval length (in bars or pixels)
   const ENUM_FUTURE_COUNT _count_type=COUNT_IN_BARS   // Interval type (pixels or bars).
)
  {
//---
   datetime
      future_time;      // Variable for result
   int
      bar_distance =  GetBarsPixelDistance(),   // Distance in pixels between two adjacent bars
      current_x,                                // The x coordinate of the starting point
      future_x,                                 // The x coordinate of the result
      current_y,                                // The y coordinate, does not affect the result; needed for the conversion function
      subwindow = 0;                            // Subwindow index
   double current_price;                        // Any initial price, does not affect the result


//--- Convert the time passed in parameters into the screen coordinate x
   ChartTimePriceToXY(0,subwindow,_start_time,CMouse::Price(),current_x,current_y);

//--- Calculate a point in the future in screen coordinates
   if(COUNT_IN_BARS == _count_type) // If the length is specified in bars,
     {
      // then the interval size should be converted to pixels.
      future_x = current_x + _length*bar_distance;
     }
   else // ... If the length is in pixels,
     {
      // use it as is
      future_x = current_x + _length;
     }

//--- Convert screen coordinates into time
   if(ChartGetInteger(0,CHART_WIDTH_IN_PIXELS)>=future_x) // If successful,
     {
      ChartXYToTimePrice(0,future_x,current_y,subwindow,future_time,current_price);  // convert the resulting value
     }
   else // Otherwise, if time cannot be calculated because it exceeds limits
     {
      future_time =        // Calculate time as usual, in seconds
         _start_time       // To the starting time
         +(                // add
            ((COUNT_IN_BARS == _count_type) ? _length : _length/bar_distance) // interval size in bars
            *PeriodSeconds()  // multiplied by the number of seconds in the current period
         );
     }
//--- Return the resulting value
   return future_time;
  }
ただし、以前のバージョンで説明されている関数が常に正しい結果を生成するとは限らないことが判明したため、書き直しが必要でした。すべてがはるかに簡単であることがわかりました。
//+------------------------------------------------------------------+
//|                                                     Utilites.mqh |
//+------------------------------------------------------------------+
//...
//+------------------------------------------------------------------+
//| Calculates a distance in pixels between two adjacent bars        |
//+------------------------------------------------------------------+
int        CUtilites::GetBarsPixelDistance(void)
  {
//--- Calculate the distance
   return ((int)MathPow(2,ChartGetInteger(0,CHART_SCALE)));
  }
//...
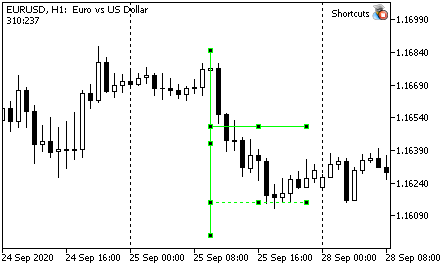
制限された水平レベル
前のセクションでこれらのレベルを示しました。これは特定の長さの線であり、理想的にはマウスを向けた場所に依存しません。これは、マウスカーソルが指している点から描画されます。したがって、点は、たとえばファンよりも少し慎重に選択する必要があります。
これらのレベルには、厳密に定義された(経験的に)ピクセル単位の長さが必要です。次に、線はさまざまなスケールでさまざまな数のバーをカバーします。
また、通常のラインレベルと拡張されたラインレベルをすべて同じスケールで記述できるようにもしたいです。
以下が結果です。
//+------------------------------------------------------------------+
//|                                                     Graphics.mqh |
//+------------------------------------------------------------------+

//+------------------------------------------------------------------+
//| Draws a horizontal level                                         |
//| Parameters:                                                      |
//|   _multiplicator - multiplier for determining the length         |
//|                of the larger level (how many times higher)       |
//+------------------------------------------------------------------+
//---
void CGraphics::DrawHorizontalLevel(
   double _multiplicator // Multiplier for the level length
)
  {
//--- Description of variables
   datetime p2_time;          // Time of point 2
   string Level_Name ="";     // Level name

//Color of the current line (equal to  the general color of the current time interval)
   color Level_Color=CUtilites::GetTimeFrameColor(CUtilites::GetAllLowerTimeframes());
   int window = 0;            // The index of the subwindow in which the line is drawn
   ENUM_LINE_STYLE Current_Style = STYLE_SOLID; // Line style
   int Current_Width=1;                         // Line width
   int level_length = 0;                        // Line length

//--- Get the length (in pixels)
   if(Short_Level_Length_In_Pixels)
     {
      // If EA parameters instruct to measure in pixels,
      level_length = Short_Level_Length_Pix; // ...Use the length from parameters
     }
   else
     {
      // Otherwise the number of candlesticks is specified in parameters
      level_length = Short_Level_Length * CUtilites::GetBarsPixelDistance();
     }

//--- Set level parameters
   if(_multiplicator>1) // If the level is extended
     {
      Level_Name = CUtilites::GetCurrentObjectName(allPrefixes[7]);
      Current_Style = Long_Level_Style;
      Current_Width = Long_Level_Width;
     }
   else                 // An if the level is short
     {
      Level_Name = CUtilites::GetCurrentObjectName(allPrefixes[6]);
      Current_Style = Short_Level_Style;
      Current_Width = Short_Level_Width;
     }

//--- Calculate real coordinates (price and time) for the second point
   p2_time = CUtilites::GetTimeInFuture(CMouse::Time(),level_length*_multiplicator,COUNT_IN_PIXELS);


//--- Draw a line using the known coordinates
   TrendCreate(0,
               Level_Name,
               0,
               CMouse::Time(),
               CMouse::Price(),
               p2_time,
               CMouse::Price(),
               Level_Color,
               Current_Style,
               Current_Width
              );
//---

   ChartRedraw(0);
  }
最初の点は、マウスポインタによって決定されます。2番目の点を計算するとき、プログラムは最初にチャートの縮尺の変更に応じて線のサイズを変更するかどうかを選択し、次に ピクセルで2番目の点の座標を計算し、価格と時間に再計算します。(使用できる関数がある場合、計算はそれほど難しくありません)。
次に、制御コマンドをShortcuts.mqhファイルに追加する必要があります。
//+------------------------------------------------------------------+
//|                                                    Shortcuts.mqh |
//+------------------------------------------------------------------+

// ...

//--- Draw a short limited level
         if(CUtilites::GetCurrentOperationChar(Short_Level_Key) == lparam)
           {
            m_graphics.DrawHorizontalLevel(1);
           }
//--- Draw an extended limited level
         if(CUtilites::GetCurrentOperationChar(Long_Level_Key) == lparam)
           {
            m_graphics.DrawHorizontalLevel(Long_Level_Multiplicator);
           }
// ...
その結果、Short_Level_Length_In_Pixelsパラメータがtrueの場合、S(Short)キーを押すと、プログラムはShort_Level_Length_Pixパラメータで指定されたピクセル単位の長さで水平セグメントを描画します。
Short_Level_Length_In_Pixels == falseの場合、レベルの長さはローソク足で測定され、Short_Level_Lengthパラメーターから取得されます。
L(Long)を押すと、行の長さが2倍になります(Long_Level_Multiplicatorパラメータで指定された数が乗算されます)。
限定トレンドライン
トレンドラインは2倍の負荷をかけることができると思います。
一方では、価格の変化率に制限があります(価格がラインを下回っている場合は「より速くない」、価格はがインを上回っている場合は「より遅くない」)。
一方、直線が価格と時間に制限がある場合(半直線ではない)、レベル(価格と時間の両方)を示すことができます。もちろん、これらの目的のために長方形などを使用することもできますが、私の意見では、対角線の方が明確です。
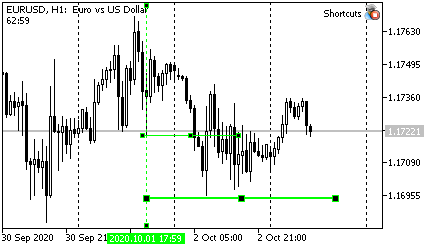
そこで、CGraphics::DrawTrendLine関数を変更しました。まず、ラインは現在、限られた時間だけ未来に続き、したがって推定価格を示しています。次に、わかりやすくするために、通常のレベル(水平および垂直)を追加しました。
次のようになります。

もちろん、線の長さ(全長が最初の点の間の距離よりも長い回数)、極値のバーの数、および直線の他の特徴は、EAパラメーターで構成されます。
//+------------------------------------------------------------------+
//|                                                     Graphics.mqh |
//+------------------------------------------------------------------+

//+------------------------------------------------------------------+
//| Draws a trend line using two nearest extreme points.             |
//|   Extremum length (number of bars on left and right) is set      |
//|   by parameters Fractal_Size_Left and Fractal_Size_Right         |
//|                                                                  |
//| There is a "Trend_Points" variable in the global parameters.     |
//|                                                                  |
//| If the variable value is equal to "TREND_DOTS_EXTREMUMS",        |
//|   end points of the straight line will lie strictly at extrema.  |
//| If the values is "TREND_DOTS_HALF", the line will be             |
//|   extended into the future by a distance of                      |
//|   (p2-p1)*Trend_Length_Coefficient                               |
//+------------------------------------------------------------------+
void              CGraphics::DrawTrendLine(void)
  {
   int dropped_bar_number=CMouse::Bar(); // candlestick number under the mouse
   int p1=0,p2=0;                        // numbers of the first and seconds points
   string trend_name =                   // trend line name
      CUtilites::GetCurrentObjectName(allPrefixes[0],OBJ_TREND);
   double
      price1=0,   // price of the first point
      price2=0,   // price of the second point
      tmp_price;  // variable for temporary storing of the price
   datetime
      time1=0,    // time of the first point
      time2=0,    // time of the second point
      tmp_time;   // a variable to store time


//--- Setting initial parameters
   if(CMouse::Below()) // If a mouse cursor is below the candlestick Low
     {
      //--- Find two extreme points below
      CUtilites::SetExtremumsBarsNumbers(false,p1,p2);

      //--- Determine point prices by Low
      price1=iLow(Symbol(),PERIOD_CURRENT,p1);
      price2=iLow(Symbol(),PERIOD_CURRENT,p2);
     }
   else // otherwise
      if(CMouse::Above()) // If a mouse cursor is below the candlestick High
        {
         //--- Find two extreme points above
         CUtilites::SetExtremumsBarsNumbers(true,p1,p2);

         //--- Determine point prices by High
         price1=iHigh(Symbol(),PERIOD_CURRENT,p1);
         price2=iHigh(Symbol(),PERIOD_CURRENT,p2);
        }
      else
        {
         return;
        }
//--- The time of the first and second points does not depend on the direction
   time1=iTime(Symbol(),PERIOD_CURRENT,p1);
   time2=iTime(Symbol(),PERIOD_CURRENT,p2);

//--- If the line should be extended to the right
   if(Trend_Points == TREND_POINTS_HALF)
     {
      //--- Temporarily save the coordinates of point 2
      tmp_price = price2;
      tmp_time = time2;

      //--- Calculate the time of the second point
      time2 = CUtilites::GetTimeInFuture(time1,(p1-p2)*Trend_Length_Coefficient);

      //--- Calculate the price of the second point
      price2 = NormalizeDouble(price1 + (tmp_price - price1)*Trend_Length_Coefficient,Digits());

      //--- Draw boundary levels by price and time
      DrawSimple(OBJ_HLINE,time2,price2);
      DrawSimple(OBJ_VLINE,time2,price2);
     }

//--- Draw the line
   TrendCreate(0,trend_name,0,
               time1,price1,time2,price2,
               CUtilites::GetTimeFrameColor(CUtilites::GetAllLowerTimeframes()),
               0,Trend_Line_Width,false,true,m_Is_Trend_Ray
              );

//--- Redrawing the chart
   ChartRedraw(0);
  }
コードのその他の変更は、黄色で強調表示されています。
残りは簡単です。点間のバーの数は(р1-р2)に等しくなります(バーの数が右に増えることを忘れないでください)。係数を使用すると、間隔をどれだけ延長するかを計算できます。3番目のパラメータを指定しなくても、デフォルトでバーでの計算が可能になるため、ユーティリティ関数を呼び出すだけです。
次に、価格を計算し、同じクラスにある前述のDrawSimple関数を使用してレベルを描画し、メインラインを描画します。
初心者は、「関数は、価格を追加する場所をどのように「知る」のでしょうか。線が上から下に行く場合は価格を引き、下から上に行く場合は価格を足す必要があります。」と聞くかもしれません。
安値にリンクされているか高値にリンクされているかは重要ではないため(関数の最初でこれを確認済み)、方向は式price1 + (tmp_price - price1)によって一意に決定されることに注意してください。
線が下に行くと、price1は2番目の点の価格よりも高くなるため、式(tmp_price - price1)は負になります。したがって、必要な距離は価格から引かれます。
線が上に行くと、2番目の点を定義する価格が最初の点よりも大きくなり、括弧内の式が正になるため、距離が初期価格に足されます。
この関数のもう1つの機能について説明します。 これは初心者向けの説明です。関数が価格を計算する場合、データは正規化する必要があります。つまり、受信した数値の小数点以下の桁数がチャートの相場と同じであることを確認する必要があります。そうしないと、エラーが発生します。NormalizeDouble関数は、価格を正規化するために使用されます。
Shortcuts.mqhファイルを変更する必要はありません。Tキー(Trend)を押すと線が引かれます。したがって、線を引くには上記の関数を呼び出す必要があります。
//+------------------------------------------------------------------+
//|                                                    Shortcuts.mqh |
//+------------------------------------------------------------------+

//...
//--- Draw a trend line
         if(CUtilites::GetCurrentOperationChar(Trend_Line_Key) == lparam)
           {
            m_graphics.DrawTrendLine();
           }
//...
垂直レベルの描画
市場にはトレンドの性質があり、価格の動きは完全にランダムではないため、ほとんどの場合、次のルールを取引に使用できます。価格は常に、すでに通過した距離と同じ距離だけ動く傾向があります。動きの方向は別の質問です。多くの場合、たとえばピンバーや大きなローソク足の端を突破した後、価格はこのバーで測定されたのと同じ距離を移動し、その後反転します。
それにもかかわらず、多くの大手トレーダー(最終的に方向を決定する可能性があります)は、100%レベルに達するより少し早くポジションを決済することを好むため、価格が一般的なレベルに達しないことがよくあります。
したがって、私は取引に分数レベルも使用します。最も頻繁に使用されるのは、7/8のレベルです。この記事で検討する最後のツールは、これらのレベルを画面に表示するように設計されています。
レベルを描画する関数が理解しやすいはずです。
//+------------------------------------------------------------------+
//|                                                     Graphics.mqh |
//+------------------------------------------------------------------+

//+------------------------------------------------------------------+
//| Draws a vertical line at levels 7/8 and 14/8 of the              |
//|   current candlestick size                                       |
//+------------------------------------------------------------------+
void CGraphics::DrawVerticalLevels(void)
  {
//--- Description of variables
   string
   Current_Vertical_Name =   // The name of the basic vertical line
      CUtilites::GetCurrentObjectName(allPrefixes[5]),
      Current_Level_Name =          // The name of the current level
         CUtilites::GetCurrentObjectName(allPrefixes[5]+"7_8_");
   double
   Current_Line_Lenth,           // The length of the current line (level or vertical)
   Current_Extremum,             // Working extremum (High or Low, depending on the mouse position
   Level_Price,                  // Level price
   High = iHigh(Symbol(),PERIOD_CURRENT,CMouse::Bar()), // The High price of the current candlestick
   Low =  iLow(Symbol(),PERIOD_CURRENT,CMouse::Bar());  // The Low price of the current candlestick
   int
   direction=0;                  // Price increment sign
   long timeframes;                 // List of working timeframes
   datetime
   Current_Date =                // Time of the current bar
      iTime(Symbol(),PERIOD_CURRENT,CMouse::Bar()),
      Right_End_Time =              // Time of the right border of the level
         CUtilites::GetTimeInFuture(Current_Date,Short_Level_Length);

//--- Calculating candlestick length
   Current_Line_Lenth = (High-Low)*2;

//--- Initialization of the main variables depending on the desired drawing direction
   if(CMouse::Above()) // If the mouse is above
     {
      Current_Extremum = High;   // The main price is High
      direction = -1;            // Drawing direction - downward
     }
   else              // Otherwise
     {
      if(CMouse::Below()) // If the mouse is below
        {
         Current_Extremum = Low; // The main price is Low
         direction = 1;          // Drawing direction is upward
        }
      else         // If the mouse is in the middle of the candlestick, exit
        {
         return;
        }
     }

//--- Vertical line
   TrendCreate(0,
               Current_Vertical_Name,
               0,
               Current_Date,
               Current_Extremum,
               Current_Date,
               Current_Extremum+(Current_Line_Lenth*2)*direction,
               CUtilites::GetTimeFrameColor(CUtilites::GetAllLowerTimeframes()),
               Vertical_With_Short_Levels_Style,
               Vertical_With_Short_Levels_Width
              );
//--- First level (7/8)
   Level_Price = Current_Extremum+(Current_Line_Lenth*Vertical_Short_Level_Coefficient)*direction;
   TrendCreate(0,
               Current_Level_Name,
               0,
               Current_Date,
               Level_Price,
               Right_End_Time,
               Level_Price,
               CUtilites::GetTimeFrameColor(CUtilites::GetAllLowerTimeframes()),
               Short_Level_7_8_Style,
               Short_Level_7_8_Width
              );
//--- Second level (14/8)
   Current_Level_Name = CUtilites::GetCurrentObjectName(allPrefixes[5]+"14_8_");
   Level_Price = Current_Extremum+(Current_Line_Lenth*2*Vertical_Short_Level_Coefficient)*direction;
   TrendCreate(0,
               Current_Level_Name,
               0,
               Current_Date,
               Level_Price,
               Right_End_Time,
               Level_Price,
               CUtilites::GetTimeFrameColor(CUtilites::GetAllLowerTimeframes()),
               Short_Level_14_8_Style,
               Short_Level_14_8_Width
              );
  }
2つの点に注意してください。まず、ここではこれらのレベルの時間は常にバーで計算されます。必要なバーの数はShort_Level_Length変数から取得されるため、測定されるバーの数は常にわかっています。
次に、ここでは1つの点だけに基づいて価格を計算する必要があります。したがって、方向に依存するパラメータを設定する必要があります。これにより、毎回再確認して重複したコードを記述する必要がなくなります。特に、最初の点を除いて、各項に乗算される方向パラメータを設定します。したがって、線の動作を説明する式は1つしかありませんが、この式の項の符号は、マウスがどこ(ローソク足の上または下)にあるかによって異なります。
最終的な形状は上の図に示されています。
Shortcuts.mqhファイルに制御構造体を追加します。
//+------------------------------------------------------------------+ //| Shortcuts.mqh | //+------------------------------------------------------------------+ //... //--- Draw a vertical line with 7/8 levels if(CUtilites::GetCurrentOperationChar(Vertical_With_Short_Levels_Key) == lparam) { m_graphics.DrawVerticalLevels(); } break;キーではV (Vertical)です。
現在のライブラリ実装で使用されているキー
| アクション | キー | 説明 |
|---|---|---|
| メインのTFの時間枠を長くする(TFパネルから) | U | Up |
| 時間枠を短くする | D | Down |
| チャートのZレベルを変える(チャートが他のすべてのオブジェクトの上になるかどうか) | Z | Z order |
| マウスに最も近い2つの一方向の極値点に基づいて傾斜した傾向線を描画する | T | Trend line |
| 新しいラインを線分モードに切り替える | R | Ray |
| 単純な縦線を描画する | I(i) | [縦のみ可視] |
| 単純な横線を描画する | H | Horizontal |
| アンドリュースピッチフォークセットを描画する | P | Pitchfork |
| フィボナッチファン (VFun)を描画する | F key | Fun |
| 短い水平レベルを描画する | S | Short |
| 拡張した水平レベルを描画する | L key | Long |
| レベルマーク付きの縦線を描画する | V | Vertical |
終わりに
この記事がお役に立てば幸いですが、保証はありません。結果として得られるツールキットは非常に柔軟性があり、あらゆる市場での作業に適しています。ただし、記事の読者がデフォルト設定で使用を開始する場合は、市場が変わる可能性があります。変化は市場の本質であるため、おそらくそれほど重要ではありません。
コメントやアイデアを共有することを歓迎します。
安定した利益をお祈りします。
MetaQuotes Ltdによってロシア語から翻訳されました。
元の記事: https://www.mql5.com/ru/articles/7908
 スプレッドシートを使ってトレード戦略を構築する
 トランスダクション・アクティブ機械学習におけるスロープブースト
 トレーディングにおけるニューラルネットワークの実用化。 Python (パートI)
 MetaTrader5のWebSocket
- 無料取引アプリ
- 8千を超えるシグナルをコピー
- 金融ニュースで金融マーケットを探索