PZ Support Resistance
- Indicadores
- PZ TRADING SLU
- Versión: 6.4
- Actualizado: 28 abril 2021
- Activaciones: 20
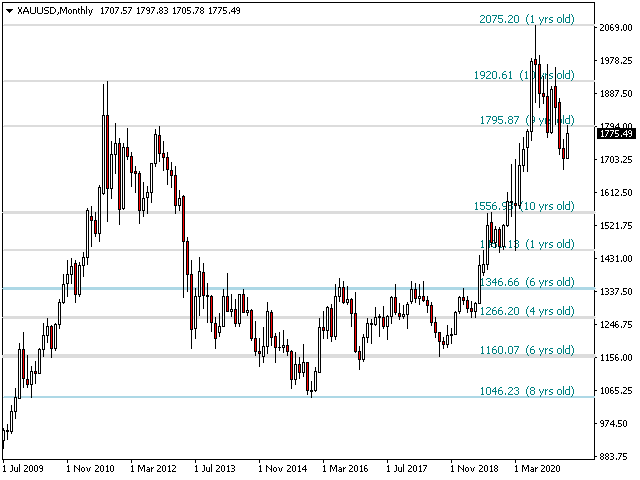
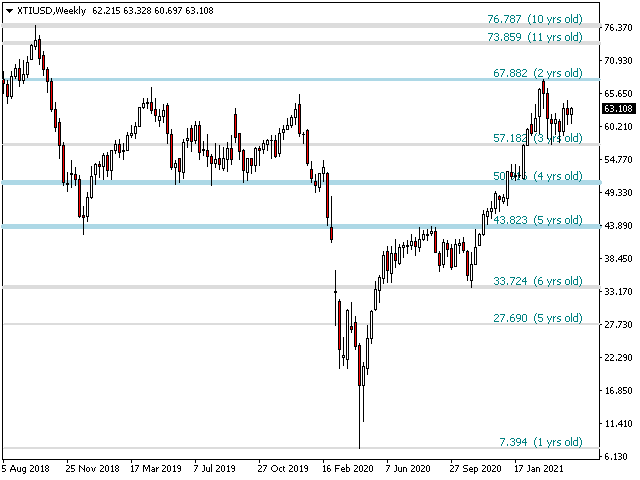
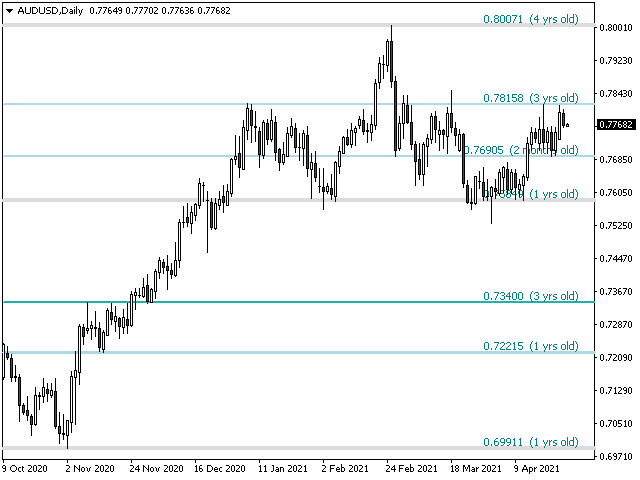
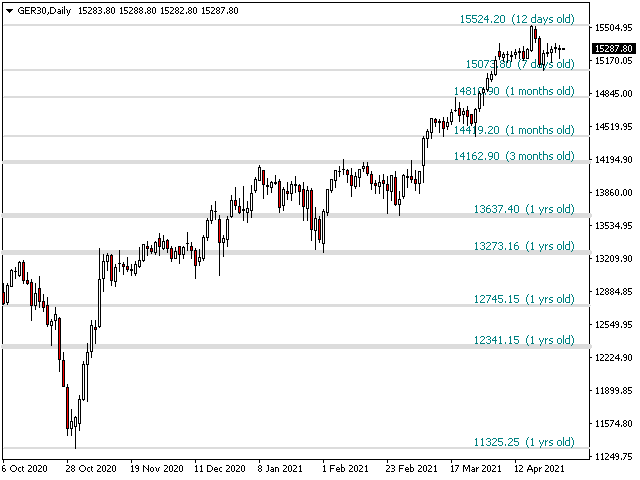
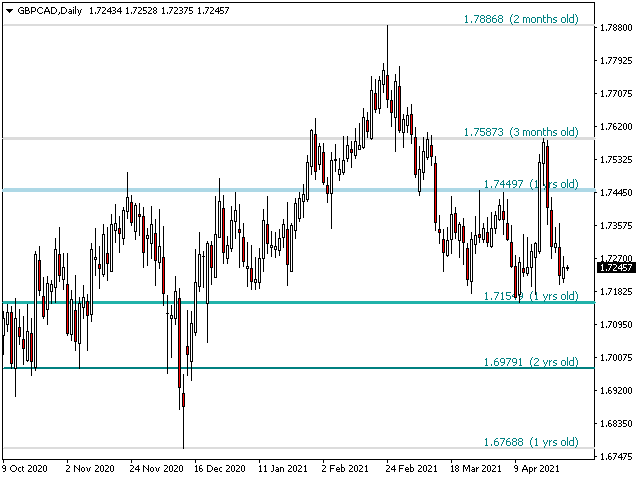
¿Cansado de trazar líneas de soporte y resistencia? La resistencia de soporte es un indicador de marco de tiempo múltiple que detecta y traza automáticamente los soportes y las líneas de resistencia en el gráfico con un giro muy interesante: a medida que los niveles de precios se prueban con el tiempo y aumenta su importancia, las líneas se vuelven más gruesas y oscuras.
[ Guía de instalación | Guía de actualización | Solución de problemas | FAQ | Todos los productos ]
- Mejora tu análisis técnico de la noche a la mañana
- Detecta niveles de precios importantes sin navegar por los gráficos
- Reconozca la fortaleza relativa de todos los niveles de precios de un vistazo
- Ahorre hasta media hora de líneas de trazado para cada operación
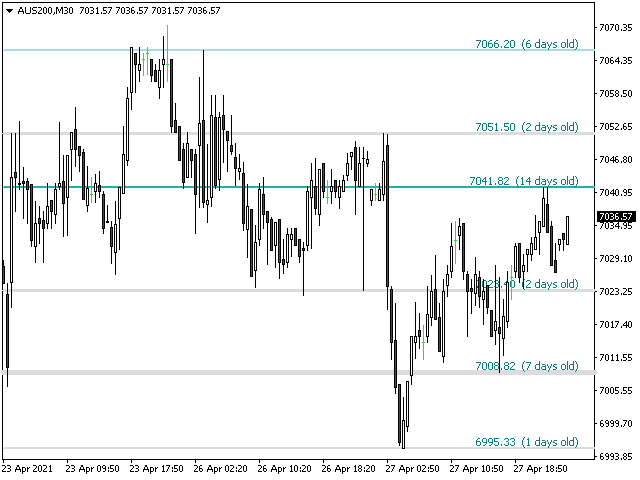
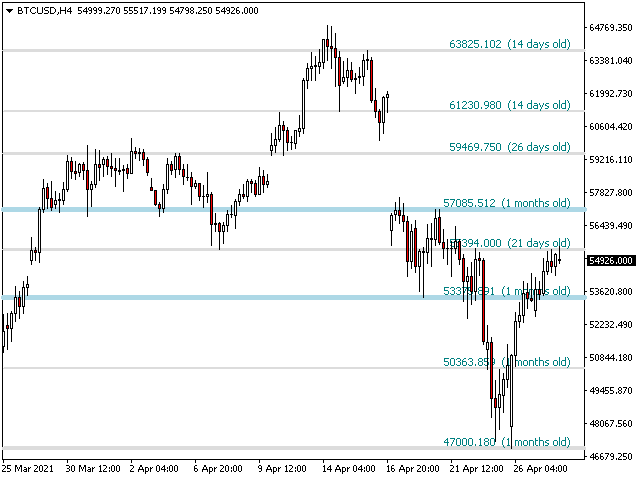
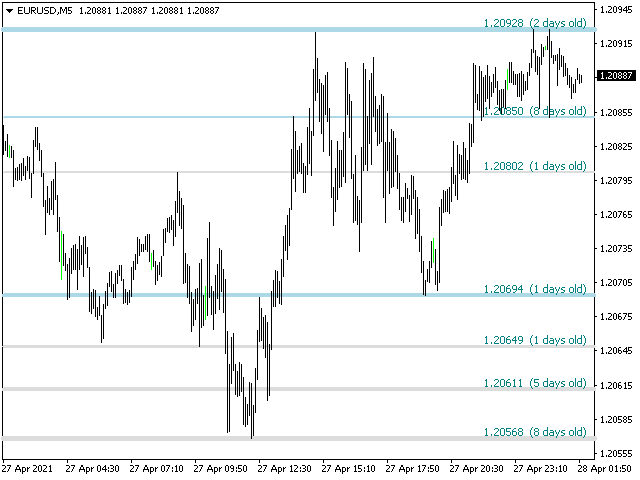
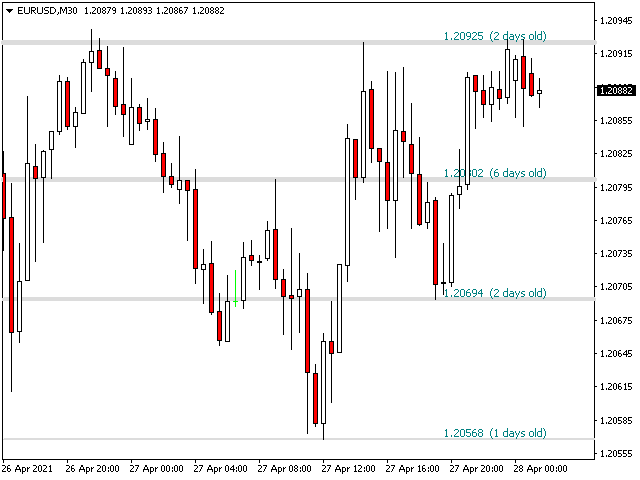
- El indicador muestra la antigüedad de todos los niveles de precios.
- El indicador no se repinta
Los niveles de precios pasados y presentes se colapsan por proximidad y se ajustan a la acción actual del mercado. Las líneas se dibujan donde está la acción y no necesariamente en los picos.
- Los niveles de precios se vuelven más oscuros y anchos a medida que se rechazan con el tiempo
- Los niveles de precios sin importancia se borran regularmente para evitar ruidos
- Selección de marco de tiempo personalizable y factor de colapso
- Implementa alertas por correo electrónico / sonido / push para desgloses
Parámetros de entrada
- Configuración del indicador: el indicador leerá el precio del período de tiempo actual, pero opcionalmente puede seleccionar otro. Por ejemplo, puede mostrar líneas de soporte y resistencia D1 en gráficos H4. También puede elegir qué cantidad de niveles de precios mostrar en el gráfico, utilizando el parámetro de densidad de nivel de precios .
- Configuración de color: ingrese los colores deseados para las líneas de soporte y resistencia según la importancia.
- Configuración de etiquetas: opcionalmente, las etiquetas que muestran la antigüedad de cada línea de soporte y resistencia se pueden mostrar en el indicador. Esto está deshabilitado por defecto. Puede elegir la fuente y el tamaño de la etiqueta.
- Alertas: habilite las alertas de pantalla / correo electrónico / push / sonido para los brotes.
Autor
Arturo López Pérez, inversor privado y especulador, ingeniero de software y fundador de Point Zero Trading Solutions.
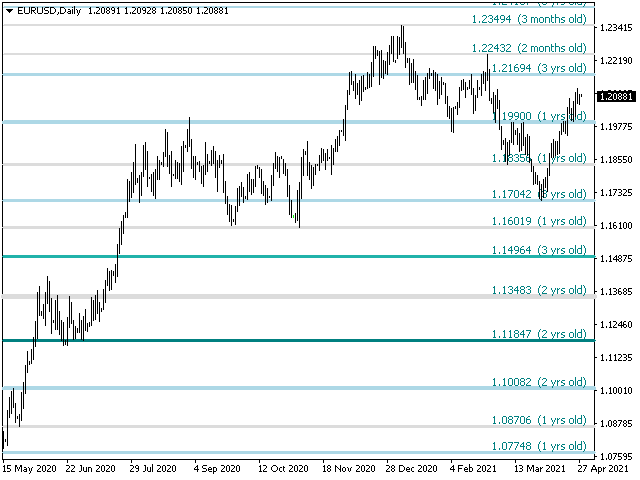
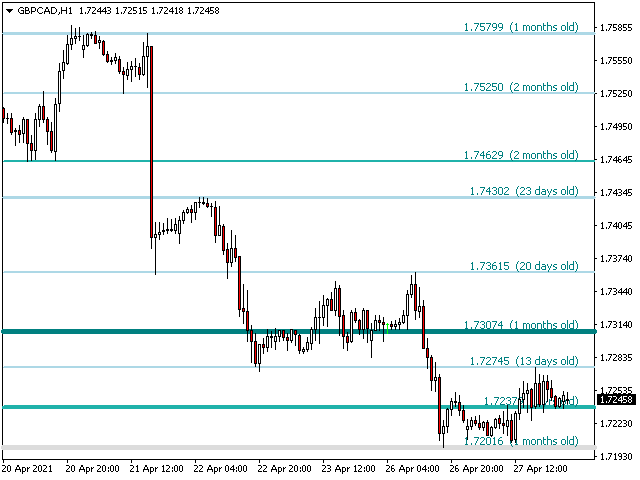
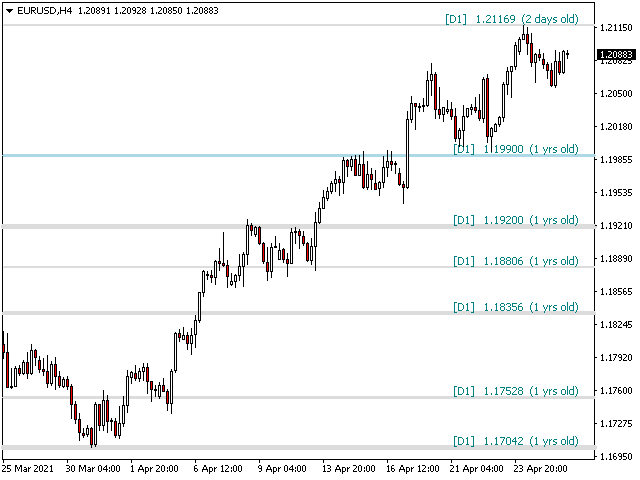


At D1 it works quite well.