Utilidades de trading para MetaTrader 4 - 19

Advisor Information: EG Connection Alert FREE every hour sends simple push notifications about the presence of a terminal connection to the server.
The utility will be useful to you if automated trading is carried out on a remote machine and there is no possibility to constantly check the operation of the terminal. Just install the adviser on any chart with any timeframe. You will receive notifications about the connection every hour. If no notifications are received, the terminal should be che
FREE

This Expert Advisor sends an email notification, generates an alert or outputs a message to the journal (depending on the settings) every time a new order is opened (buy, sell, limit, stop). It also sends a similar message about closure of orders. The EA can be useful for those who want to always be informed of which orders had been opened/closed on the account. Limitations: In this demo version, notifications are available only for the GBPCHF currency pair. To use notifications on all currency
FREE

Dear Friends, Practise master is a Utility program design to work in Live and Strategy Tester. But Main purpose is to work in Strategy Tester. With the help of this program you can take a good practise in strategy Tester. Please rate this application for the better
Benefits. 1. Save lot of time when using this program in Live or Strategy Tester. 2. Very useful to beginners. Demo account will not work in Sat & Sun Days(Market closed days). But for many users have office leave in Sat & Sun(
FREE

Easy Virtual Trader > Test Version
Setup Easy Virtual Trader > Input your Rules > You are ready to trade from mobile or another EA or anywhere....Let robot manage your Trades ! This powerful EA will help you manage ALL or SPECIFIC trades automatically based on your PRE-SET rules and settings Once it is setup and running on just one chart, you don't need to monitor your orders anymore, the software will keep watching and control your orders with your predefined rules You can trade from your de
FREE

Left4Trade MT4 Script
A script allows displaying the closure of a trade on the current chart. It helps to see where the trade was opened and closed and how it affects the overall trading result.
When using this script, arrows indicating the opening and closing of trades are displayed on the chart. They can be configured with different colors according to your preferences.
One of the main advantages of using this script is the ability to quickly analyze trading operations, which allows you
FREE

Solo se puede usar en EURCHF / M15. El Asesor Experto es una gran herramienta que le permite controlar su comercio con facilidad y precisión. La herramienta se puede desplazar en el gráfico y ofrece las siguientes características:
Entrada de orden instantánea con un solo clic.
Entrada de órdenes pendientes utilizando etiquetas de precio y líneas de tendencias. Cierre de orden instantánea con un solo clic. Cierre de orden instantánea utilizando líneas de tendencia como niveles de salida que el
FREE

Overview The script displays information about the trade account and the current financial instrument. Information about the trade account: Account - account number and type (Real or Demo); Name - name of the account owner; Company - name of a company that provide the access to trading; Server - trade server name; Connection State - connection state; Trade Allowed - shows whether trading is allowed on the account at the moment; Balance - account balance; Equity - account equity; Credit - amount

Description Keltner's colored channel indicator,also called STARC band, drawn in the main chart window. The indicator uses the calculation technique of the three drawing options: basic, improved and modified . The first two were proposed by Keltner, the third one - by a successful trader L. Rakshe. You can also search for your own best parameters of the indicator. The upper, middle and lower bands can be colored. The indicator includes the basic analytical tool of the market moods by Keltner. Th
Profitstat premium version scans your trading history and displays performance on the chart. The premium version is far more flexible than the free one. The premium version contains the following features that you won't find in the free version: Ability to horizontally position the indicator as you prefer. Ability to display results in money or in pips with the option to hide or display one or both of them. An option to show stats for only the chart symbol. An option to only show data from a cer
Description Keltner's colored multicurrency/multisymbol channel indicator, also called STARC band, drawn in a separate window below the chart of the main financial symbol. The indicator uses the calculation technique of the three drawing options: basic, improved and modified . The first two were proposed by Keltner, the third one - by a successful trader L. Rakshe. You can also search for your own best parameters of the indicator. The upper, middle and lower bands can be colored. The indicator
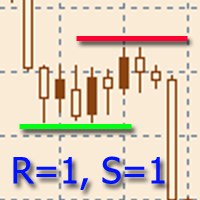
The indicator is designed to build horizontal support and resistance levels. The level search algorithm is based on the grouping of extremes. It is possible to display statistical information for each level, filter the display of levels by a number of properties, adjust the color scheme depending on the type of level (support or resistance). Features:
The indicator is ready to work and in most cases does not require special settings Manual or automatic selection of the range of extrema grouping

TimeFilter indicator allows you to visually select bit masks (GoodHourOfDay, BadHoursOfDay, GoodDayOfWeek, BadDaysOfWeek) for the Intraday Time Filter module of trading signals of the Standard Library. The use of time filters allows you to take into account the particulars of each trading session in performing trading operations.

The indicator is an inter-week hourly filter. When executing trading operations, the indicator allows considering time features of each trading session. Permissive and restrictive filter intervals are set in string form. The used format is [first day]-[last day]:[first hour]-[last hour]. See the screenshots for examples. Parameters: Good Time for trade - intervals when trading is allowed. Bad Time for trade - intervals when trading is forbidden.
time filter shift (hours) - hourly shift. percent
Description Fibo Levels is an indicator that automatically plots Fibonacci levels. The levels are calculated and plotted over a certain interval using the number of bars specified by the user . When the price achieve one of the target levels (23.6%, 38.2%, 50% or 61.8%) the indicator at the request of the user gives a sound signal and/or sends the message by e-mail. Example of the e-mail notification: Subject: Fibo Up Signal Message: Signal,H1 - Correction of EURUSD reached 23.6% - 2014

El EA modifica el nivel de Stop Loss de la posición abierta (en el instrumento actual). El SAR Parabólico , NRTR (Nick Rypock arrastre reversa) , se utilizan indicadores de MA o la regresión lineal del canal . Modos conmutables: Trailing stop sólo cuando se obtienen ganancias; Trailing stop solamente al precio; Trabajar en cada tick o en barras (formadas) completadas; Trailing para cada orden o la posición acumulativa.
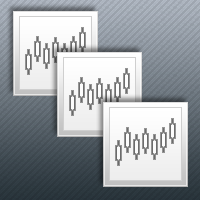
The Synchronized Charts script allows comparing bars of different symbols or different periods of the same symbol. Attach the script to a chart and move bars or change the scale, all opened chart will move synchronously with the current one. The bars on different charts aligned to the border according to their open time. Please be sure the relevant history datas have been downloaded before synchronize charts. 。。。。。。。。。。。。。。。。。。。。。。。。。。。。。。。。。。。。。。。。。。。。。。。。。。

The EA performs trade operations of closing position groups. Positions are grouped by type. It is possible to select orders by the profit (loss) value. It is possible to form the closure groups manually. You can set a value for automatic closure of a positions group after reaching a certain profit/loss level or price level. The additional functions of the EA are called using the hot keys: SHIFT+A - show/hide Auto exit options. SHIFT+S - show/hide Settings panel. SHIFT+V - sound ON/OFF. SHIFT+I -
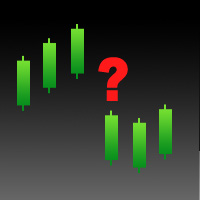
This product is used to check the foreign exchange market history datas. Good quality historical datas is important for traders to perform market analysis or back testing. But the quality of historical datas provided by various foreign exchange brokers is uneven. Sometimes we notice missing k-line sequences, but sometimes it is not easy to detect them. This product helps users locate these missing locations.If there are many gaps in a given period of time on a chart, you need to be careful about

The Expert Advisor for increasing (or opening) market positions. Allows specifying the desired risk, target and searching for the best open price and trade volume.
Configurable Parameters: lots - directly the volume of the position increase.
% equity - the amount of growth as a percentage of the amount of funds.
stop loss - directly the level of the stop loss order.
loss - the level of the stop loss order depending on the allowable loss.
take profit - directly the take profit level of
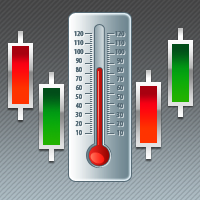
Some trading strategies are suitable for the quiet market with less volatility, while others are suitable for the volatile and violent market. Either way, traders should have a clear measure of how hot or cold the market is. This product is convenient for traders to compare the degree of cold heat of different trading varieties, or the trading heat of the same trading variety in different time periods. You can put it on different charts to get the intuition. It's easy to see which is more hot an

Description Fibo Levels is a color multicurrency/multi-symbol indicator that automatically plots Fibonacci levels on a candlestick chart in a separate window below the chart of the main financial instrument. It can be used with any broker, regardless of the name of a financial instrument used because the symbol name must be entered manually as an input parameter. If you enter a non-existent or invalid name of a financial instrument, you will receive an error message saying that the specified f

Description Fibo Levels is a color multicurrency/multi-symbol indicator that automatically plots Fibonacci levels on a Heiken Ashi chart in a separate window below the chart of the main financial instrument. It can be used with any broker, regardless of the name of a financial instrument used because the symbol name must be entered manually as an input parameter. If you enter a non-existent or invalid name of a financial instrument, you will receive an error message saying that the specified

Description Fibo Levels is a color multicurrency/multi-symbol indicator that automatically plots Fibonacci levels on any of the following six standard indicators ( AD, OBV, MA, Momentum, ATR and StdDev ) in a separate window below the chart of the main financial instrument. It can be used with any broker, regardless of the name of a financial instrument used because the symbol name must be entered manually as an input parameter. If you enter a non-existent or invalid name of a financial ins

Description Impulse Pro is an indicator's impulse trading system based on Moving Average and MACD Line . The idea of the impulse system based on Moving Average and MACD Histogram was first offered by Dr. Alexander Elder in his book "Come Into My Trading Room". The system allows users to choose the calculation method (Moving Average and MACD Line) based on a single, double or triple moving average. You can color bullish and bearish moods.
Inputs Calc_Method - Moving Average and MACD Line calcul

Description Impulse Pro is an impulse system based on two indicators - Moving Average and MACD-Histogram . The impulse system was first designed by A. Elder and is featured in his book "Come Into My Trading Room: A Complete Guide to Trading". The system is based on the Moving Average and MACD-Histogram. This product is distinct in that it allows the user to choose the system calculation method (Moving Average and MACD-Histogram) based on a single, double or triple moving average. There is pos
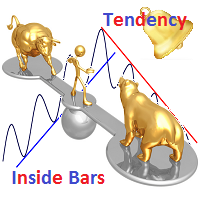
Description The indicator determines the appearance of internal bars on the chart, and paints them in accordance with the bullish and/or bearish mood. The indicator is different from Inside Bar in the same way as Tendency Reversal Bars is different from Reversal Bars . In other words, the indicator defines the appearance of internal bars during a bullish or bearish trend rather than defining their single appearance. The indicator can notify of the appearance of a formed internal bar by playi

Description Impulse Pro Global is an indicator's impulse trading system based on Moving Average and MACD Line Global . The idea of the impulse system based on Moving Average and MACD Histogram was first offered by Dr. Alexander Elder in his book "Come Into My Trading Room". The system allows users to choose the calculation method ( Moving Average and MACD Line Global ) based on a single, double or triple moving average with identification of primary signal of probable reverse of the previ

CorExTi es una herramienta que te ahorrará horas literalmente en tu rutina diaria al trazar líneas y otros elementos gráficos en tu plataforma: Con un panel temporal que aparece discretamente sobre tu pantalla al tocar un elemento gráfico como línea de tendencia: Cambia el objeto entre 4 estilos favoritos de línea (con color, grueso de línea y estilo de la misma) Corta las líneas de tendencia extendidas justo en el punto donde las tocas Extiende líneas de tendencia (activa propiedad de Rayo) la

La mejor forma de monitorear multiples pares en poco espacio de trabajo, Rotagrafico muestra secuencialmente hasta 6 pares distintos Cuenta con botones para fijar un tiempo mayor un par en observación Tiempo de exposición normal ajustable Tiempo de exposición amplio ajustable Combine en 1 profile a Rotagrafico y el resto de su espacio utilícelo en el gráfico del par que desea observar a detalle.

Description Impulse System Global is an indicator impulse trading system based on Moving Average and MACD Histo Global . The idea of the impulse system which is based on Moving Average and MACD Histogram was first offered by Dr. Alexander Elder in his book "Come Into My Trading Room". The system allows users to choose the calculation method ( Moving Average and MACD Histo Global ) based on a single, double or triple moving average with identification of primary signal of probable reve

Description Impulse Grand Global is an indicator impulse trading system based on Moving Average and MACD Classic Global . The idea of the impulse system based on Moving Average and MACD Histogram was first offered by Dr. Alexander Elder in his book "Come Into My Trading Room". The system allows users to choose the calculation method ( Moving Average and MACD Classic Global ) based on a single, double or triple moving average with identification of primary signal of probable reverse of

This script allows you to close all orders and delete all pending orders. Set to true order type you want to close and cancel. Parameters:
AllCurrency = set true to close position and cancel order in all pair, set false for current pair. CloseBUY = set true to close buy position. CloseSELL = set true to close sell position. DeleteBUYSTOP = set true to cancel buy stop order. DeleteSELLSTOP = set true to cancel sell stop order. DeleteBUYLIMIT = set true to cancel buy limit order. DeleteSEL

¿Alguna vez has tenido que comenzar un análisis dese el principio porque en el gráfico original tiene tanta información que es difícil leerlo? ¿Has querido que pudieras hacer que un elemento de dibujo en alguna de tus gráficas apareciera replicada en varias gráficas de tu set? Object Copier es la solución para replicar cualquier objeto en una o tantas gráficas desees, instantáneamente. No importa si es porque has cambiado la posición de una línea de tendencia o el formato de una etiqueta de text

La Controladora es como un controlador Español, un Asesor Experto simple pero potente que le permite controlar su trading con facilidad y precisión. ¿Desea detener su trade cuando el precio cruza una línea de tendencia? No te preocupes, la Controladora puede hacerlo. ¿Quieres tomar ganancias cuando el precio alcanza la parte superior de un canal? La Controladora puede hacerlo. Calculando la proporción exacta de su cuenta mediante la apertura de un trade, cuyo tamaño representa, en caso de pérdid

The Expert Advisor notifies that a price has crossed a line on the chart. It handles two types of lines - horizontal line and a trendline. The number of lines is unlimited. Parameters: prefix of signal line - prefix of object (line) names processed by the indicator. If the parameter is empty, it handles all object types: horizontal lines and trendlines. price Mode - price type (bid or ask). timeout - crossing alert timeout. number of repeats - the limit of crossing alert repeats. number of comme

La mejor forma de aumentar la claridad y por tanto, facilidad para leer tus gráficos es simplemente eliminar los niveles de fibonacci que ya no usas en tu gráfica, como aquellos niveles donde ya se probó que no funcionaron como niveles de soporte o resistencia, pero hacer esto con Metatrader era toda una monserga… hasta ahora. Con Fibo pro tu podrás activar o desactivar de una lista preconfigurada, por ti mismo, de niveles simplemente haciendo un par de clics, sin la necesidad de abrir el panel

Auto Trade Driver es una potente herramienta automática (trabaja como Asesor Experto) que le ayudará a gestionar los riesgos y controlar las órdenes para maximizar los beneficios con las reglas de multiprotección y Trailing Stop. Esta herramienta va a ser muy útil tanto para los scalpers, como para los traders que operan siguiendo la tendencia. No sólo calcula con precisión el riesgo de trading, sino también protege y aumenta el beneficio en tiempo real. Lo único que necesita hacer a la hora de

Description Impulse Smart is an indicator impulse trading system based on Moving Average and MACD Classic Smart with sound notification . The idea of the impulse system based on Moving Average and MACD Histogram was first offered by Dr. Alexander Elder in his book "Come Into My Trading Room" . The system allows users to choose the calculation method ( Moving Average and MACD Classic Smart ) based on a single, double or triple moving average with identification of primary signal of pr

Description Fibo Levels Custom is a color multicurrency/multi-symbol indicator that automatically plots Fibonacci levels on the Market Mood Oscillator in a separate window below the chart of the main financial instrument. It can be used with any broker, regardless of the name of a financial instrument used because the symbol name must be entered manually as an input parameter. If you enter a non-existent or invalid name of a financial instrument, you will receive an error message sayin

This is a semi-automatic Expert Advisor. A user draws a support or a resistance line in the form of a horizontal line or a trendline on a chart. A command in the format of UP|DN_xxxx:yyyy is specified in the line name; the Expert Advisor understands it as a signal to buy or sell setting a stop loss and a take profit. EA settings include a parameter with a lot size and a value for moving stop loss to breakeven. If stop loss = 0, the EA does not use breakeven. If this parameter is greater than zer
Este asesor proporciona las siguientes características: Abra una posición: cuando el precio cruce la línea de tendencia, abra una orden larga o corta. Cierre: cuando el precio cruce la línea de tendencia, cierre su posición larga o corta. Trailing Stop Loss: el EA continuará aumentando el stop loss para órdenes largas o reduciendo el stop loss para órdenes cortas a lo largo de la línea de tendencia. La línea puede ser una línea de tendencia o una línea horizontal, Las líneas de tendencia p

Description Fibo Retracement is an indicator that automatically plots Fibonacci levels in the main chart based on Close prices , which distinguishes it from the Fibo Levels indicator that plots levels based on High/Low prices. Thus, using both indicators provides the trader with the opportunity of determining support and resistance zones by Fibonacci! The levels are calculated and plotted over a certain interval using the number of bars specified by the user. The user can display Fibonacci l
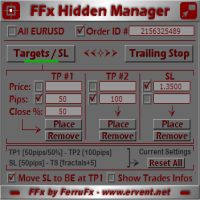
El panel del Administrador oculto del FFx le ayudará a gestionar fácilmente sus órdenes directamente en el gráfico. A continuación descripción de todas las características: TP, SL y TrailingStop están ocultos Cada orden tiene sus propias líneas en gráfico Arrastrar y soltar cualquier línea para cambiar el TP/SL según su necesidad Opción para mover automáticamente la línea SL en equilibrio cuando se alcanza el TP Nº 1 Opción de elegir el tipo TP/SL (por pips o precio) Opción de elegir el tipo de

Description Strongest Level is an indicator that automatically plots the nearest levels of strongest resistance and support in the main chart based on prices of the current timeframe. Repeated usage of the indicator with various number of bars creates a system of support and resistance! The indicator calculates and plots levels based on number of bars set by the user. It is recommended to set numbers from a golden ratio according to Fibonacci (13, 21, 34, 55, 89, 144, 233, 377, 610 etc.). Users

Description Strongest Higher Level is an indicator that automatically plots the nearest level of strongest resistance and support in the main chart based on prices of the higher timeframe that differs it from Strongest Level indicator. Repeated usage of the indicator with various number of bars creates a system of support and resistance! The indicator calculates and plots levels based on number of bars set by the user. It is recommended to set numbers from a golden ratio according to Fibonacci

I like trading manually, so I created this tool to make my trade more easier and faster.
Features Money management. Click for place order ( Buy/Sell/BuyStop/BuyLimit/SellStop/SellLimit). Many buttons for control your account (Close All, Remove Pendings, Breakeven, Hedging). Auto hide if not use for 2 minutes. See profit on current symbol. Free to move panel to where you want. Save your settings for using on next time. Special: It's work on backtest mode! You can use this for training yourself.
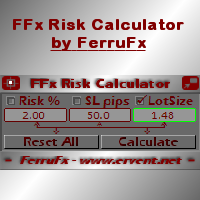
FFx Risk Calculator panel will help you to calculate very easily your trades size, SL or the risk directly on the chart. All features are described below: Option to select which parameter to calculate: Risk, Stop Loss or Lot Size The panel will show if the lot size is allowed according to the current account free margin Button to maximize/minimize the panel Drag and Drop the panel anywhere on the chart How to use it? Select the parameter you want to be calculated. It will be based on the 2 other

El BreakEven es un indicador que te muestra el precio promedio de las ordenes de un par considerando tanto el precio como el volumen de cada una de las operaciones abiertas y activas bajo el par desplegado en la gráfica a la que agregas el indicador. El indicador es de gran ayuda para los que manejan múltiples operaciones a la vez como para los que tradean con una sola orden por par debido a que te puede mostrar el desempeño de la operación(es) abiertos bajo el par, así como el efecto que tendrá
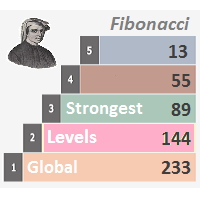
Description Strongest Levels Global is a colored multicurrency/multisymbols indicator that automatically plots a system of the nearest levels of strongest resistance and support in the separate window on one of nine different indicators of the current timeframe in accordance with user's choice. Repeated usage of the indicator with various number of bars creates an extended and confirmed system of support and resistance! The indicator calculates and plots levels based on the number of bars set b

Description DealsCopyMaster opens additional positions on a single symbol in the appropriate amount and tracks them automatically. Opening additional positions may be necessary in case a subscriber starts to lag behind the provider dramatically in the volumes of the currently opened positions and in the volumes difference when provider's balance was at some moment of time equal to the current subscriber's one. In multicurrency/multisymbol mode, the EA is attached to the chart of each financial i

Trades Viewer is a trading helper app for a serious trader. It offers several important data like day range, 22 days average range and predefined PL. It draws trades history and current open positions on a chart. It has a detail panel for viewing a particular trade with just a click on that trade. All these make it very convenient and straightforward to view your entry/exit positions and thus improve your trading system.
Features Profit/loss of the current symbol, counting all trades of the sy

Attention: Demo version for review and testing can be downloaded here . It does not allow trading and can only be run on one chart.
Active Lines - a powerful professional tool for operations with lines on charts. Active Lines provides a wide range of actions for events when the price crosses lines. For example: notify, open/modify/close a position, place/remove pending orders. With Active Lines you can assign several tasks to one line, for each of which you can set individual trigger condi
Es un sistema consistente de 2 componentes: RepliTrades Source: Manda las órdenes de una a más terminales dentro de la misma computadora y RepliTrades Trader: Opera las órdenes enviadas por RepliTrades Source Por favor vea el video para aprender cómo funciona y se utiliza Características: Maneja hasta 300 órdenes al mismo tiempo en cada terminal Trabaja con cualquier broker sin importar si agrega prefijos o sufijos a los distintos pares Replica ordenes pendientes u operaciones directas y sus mod
Es un indicador que te ayuda colocando una referencia visual en el gráfico que te permitirá fácil y rápidamente determinar si un trade de scalping o intradiario tiene buenas posibilidades de resultar en tu favor. Uno de los problemas más comunes para los operadores de intradiario, es la pérdida de referencia para saber si un movimiento es grande o pequeño debido al auto escalado del gráfico (en dias de gran acción las velas parecen chicas cuando en realidad involucran muchos pips y viceversa p

Este indicador muestra un cursor de cruz en todas las gráficas visibles de la plataforma, en la posición relativa al cursor de la gráfica activa. Para activar el Pointer Sync solo presione el botón que aparecerá en una de las 4 esquinas del gráfico cuando se agrega el indicador. Para desactivar el Pointer Sync solo presione el botón nuevamente. Una vez desactivado el Pointer Sync, las lineas de cruz de los otros gráficos desaparecerán también. El color y tamaño del botón del pointer puede ser ca
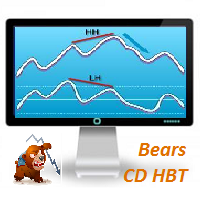
Description Bears CD HBT (Bears Convergence/Divergence High Bottom Top) is a universal analytical bears convergence/divergence indicator between a financial instrument and any of the twenty two standard indicators included in МT4 package. The indicator is the first out of the two possible versions (HBT and HTB) of the bearish convergence/divergence origins. Due to its multiple use feature, the indicator allows you to find convergences/divergences between the price and various standard indicators

Overview A One-Cancels-the-Other Order (OCO) is a pair of orders stipulating that if one order is executed, then the other order is automatically cancelled. Verdure OCO EA brings this functionality to MT4. This EA is a robust implementation of the popular One-Cancels-the-Other Order (OCO) but with added benefits, features and options. It is an EA that helps with trade management and especially useful for traders who use stop and reverse trading systems, traders who look for opportunities around
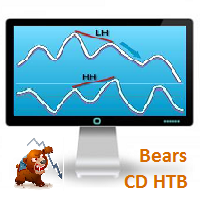
Bears CD HTB (Bears Convergence/Divergence High Top Bottom) is a universal analytical bears convergence/divergence indicator between a financial instrument and any of the twenty two standard indicators included in МetaTrader 4 package. The indicator is the second out of the two possible versions (HBT and HTB) of the bearish convergence/divergence origins. Due to its multiple use feature, the indicator allows you to find convergences/divergences between the price and various standard indicators
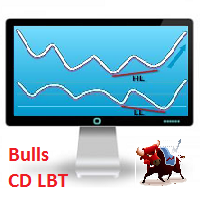
Description Bulls CD LBT (Bulls Convergence/Divergence Low Bottom Top) is a universal analytical bulls convergence/divergence indicator between a financial instrument and any of the twenty two standard indicators included in МT4 package. The indicator is the first out of the two possible versions (LBT and LTB) of the bullish convergence/divergence origins. Due to its multiple use feature, the indicator allows you to find convergences/divergences between the price and various standard indicators
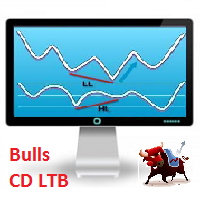
Description Bulls CD LTB (Bulls Convergence/Divergence Low Top Bottom) is a universal analytical bulls convergence/divergence indicator between a financial instrument and any of the twenty two standard indicators included in МT4 package. The indicator is the second out of the two possible versions (LBT and LTB) of the bullish convergence/divergence origins. Due to its multiple use feature, the indicator allows you to find convergences/divergences between the price and various standard indicators

Tener un trade a punto de tocar el Take Profit y de pronto ver que el precio se regresó y se fue justo a romper el Stop Loss es una de las pocas cosas que me hacen maldecir (y mucho). Bueno pues pensando en eso es que programé el AntiCursing (significa Anti-Maldecir). Solo agrega este expert adviser a una gráfica vacía, establece el nivel gatillo y el % de protección y tendrás una razón menos para maldecir. Deja explicar la configuración del AntiCursing: "Activar al %" aquí podrás definir el
Description Price CD HBT (Price Convergence/Divergence High Bottom Top) is a innovative universal analytical bears indicator of convergence/divergence between financial instruments. The indicator is the first out of the two possible versions (HBT and HTB) of the bearish convergence/divergence origins. Due to its multiple use feature, the indicator allows you to find convergences/divergences between the price of main financial instrument and other financial instruments simultaneously. Users can s
Description Price CD HTB (Price Convergence/Divergence High Top Bottom) is a innovative universal analytical bears indicator of convergence/divergence between financial instruments. The indicator is the first out of the two possible versions (HBT and HTB) of the bearish convergence/divergence origins. Due to its multiple use feature, the indicator allows you to find convergences/divergences between the price of main financial instrument and other financial instruments simultaneously. Users can s
Description Price CD LBT (Price Convergence/Divergence Low Bottom Top) is a innovative universal analytical bulls indicator of convergence/divergence between financial instruments. The indicator is the first out of the two possible versions (LBT and LTB) of the bullish convergence/divergence origins. Due to its multiple use feature, the indicator allows you to find convergences/divergences between the price of main financial instrument and other financial instruments simultaneously. Users can se
Description Price CD LTB (Price Convergence/Divergence Low Top Bottom) is a innovative universal analytical bulls indicator of convergence/divergence between financial instruments. The indicator is the second out of the two possible versions (LBT and LTB) of the bullish convergence/divergence origins. Due to its multiple use feature, the indicator allows you to find convergences/divergences between the price of main financial instrument and other financial instruments simultaneously. Users can s
Description Strongest Levels Multicurrency is a colored multicurrency/multisymbols indicator that automatically plots a system of the nearest levels of strongest resistance and support in the separate window on a chart of financial instrument in accordance with user's choice. The indicator calculates and plots levels based on the number of bars set by the user. It is recommended to set numbers from a golden ratio according to Fibonacci (13, 21, 34, 55, 89, 144, 233, 377, 610 etc.). The indicator
Tick Chart — full-featured chart for MetaTrader 4. A utility for creating and working with a tick chart in the MetaTrader 4 terminal. You can create a tick chart that works exactly the same as a regular chart. You can apply indicators, Expert Advisors and scripts to the tick chart. You get a fully functional tick chart on which you can work just as well as on a regular chart. You can enable the output of the Ask price data. The data are generated in the form of the upper shadow of a tick bar. Fr

Al dibujar una línea de tendencia u otros objetos, hay una desviación natural cuando se coloca el objeto a partir de un marco de tiempo más alto y luego lo miras en marco de tiempo más bajo. Perfect Line es un indicador técnico que resuelve este problema. Una vez que toque una línea después de dibujarlo, Perfect Line encontrará el lugar exacto en el marco de tiempo más bajo disponible para su posición y luego rectificará donde debe estar. PerfectLine utiliza una tolerancia preestablecida de 5 pí

My Money Manager como un controlador de riesgo, que pone sus trades con el volumen exacto que cumple con su riesgo de stop loss deseado. También puede ayudarle a escuchar sus niveles EP/SL/TP antes de poner una orden arrastrando estos niveles directamente en un gráfico y mantener información acerca de ellos durante la posición de apertura. Con esta herramienta, usted se sentirá más cómodo cuando decida abrir órdenes, así como previsión de sus beneficios/pérdidas con sus órdenes. La colocación de

Trade Controller provides multiple methods to protect and maximize your profits. This powerful weapon helps you to set the protect and trailing-stop rules on your trade automatically in many effective methods. Once it is set and turned on, you don't need to monitor your orders anymore, the software will keep watching and control your orders with your predefined rules. It's designed to support multi-protection and trailing strategy: Protect by break-even, protect by percentage, protect by pip, pr
El Mercado MetaTrader es una plataforma única y sin análogos en la venta de robots e indicadores técnicos para traders.
Las instrucciones de usuario MQL5.community le darán información sobre otras posibilidades que están al alcance de los traders sólo en nuestro caso: como la copia de señales comerciales, el encargo de programas para freelance, cuentas y cálculos automáticos a través del sistema de pago, el alquiler de la potencia de cálculo de la MQL5 Cloud Network.
Está perdiendo oportunidades comerciales:
- Aplicaciones de trading gratuitas
- 8 000+ señales para copiar
- Noticias económicas para analizar los mercados financieros
Registro
Entrada
Si no tiene cuenta de usuario, regístrese
Para iniciar sesión y usar el sitio web MQL5.com es necesario permitir el uso de Сookies.
Por favor, active este ajuste en su navegador, de lo contrario, no podrá iniciar sesión.